Unconfirmed US-Iran deal may unlock Iranian oil exports, pressure WTI prices. (Pivot Orderbook analysis)
…
This is a premium post.
[s2If !current_user_can(access_s2member_level4)]Please register for FREE REGISTER to read full post below containing analysis. In case of any error or you think you are not able to read the full post below, please email us at support#nehcap.com [lwa][/s2If] [s2If current_user_can(access_s2member_level1)]
- Unconfirmed US-Iran deal may unlock Iranian oil exports, pressure WTI prices.
- Saudi Arabia’s crude oil output cut of 1M bpd softens WTI’s decline.
- US Dollar weakness caps WTI’s fall as jobs report spurs rate hike uncertainty.
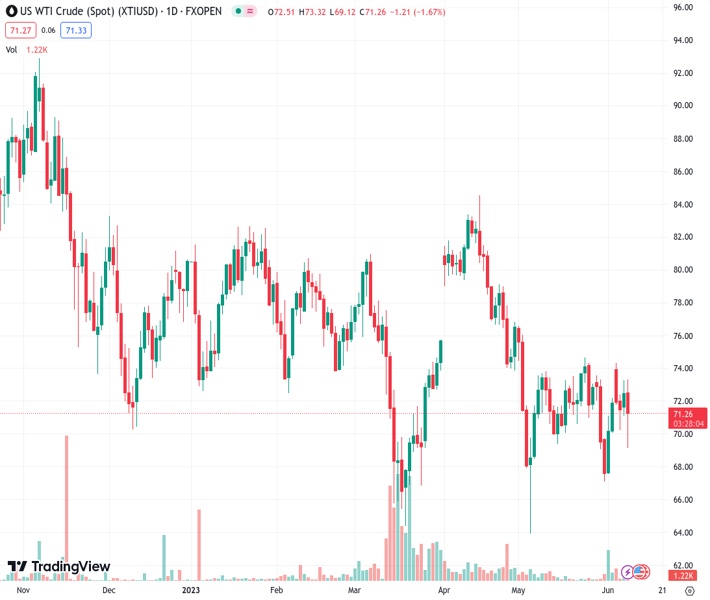
The pair currently trades last at 70.88.
The previous day high was 73.27 while the previous day low was 71.11. The daily 38.2% Fib levels comes at 72.44, expected to provide resistance. Similarly, the daily 61.8% fib level is at 71.93, expected to provide resistance.
Western Texas Intermediate (WTI), the US crude oil benchmark, dropped sharply during Thursday’s North American session, courtesy of an “unconfirmed” report that the United States (US) and Iran may be near a temporary nuclear deal, which could unblock sanctions imposed by the US on Iran oil exports. WTI is trading at $70.38, below its opening price by 2.82%.
According to Reuters, “Oil fell on a news report, citing sources, that Iran and the US are nearing a temporary deal that would trade some sanctions relief in exchange for reducing Iran’s uranium enrichment.”
If Iran agrees to reduce its uranium-enriched development, it could export up to a million barrels of oil daily and access frozen funds abroad.
WTI’s fall was cushioned by over-the-weekend developments with the Organization of Petroleum Exporting Countries and its allies (OPEC+) meeting on Sunday, with Saudi Arabia agreeing to cut its crude oil output by 1 million barrels per day (bpd) in July, as the cartel tries to boost oil prices.
Another factor that capped WTI’s fall was stockpiles in the US dropped last week by 451K barrels on June 2, as reported by the US Energy Information Administration (EIA). The markets expected a rise of 1M barrels per day.
Notably, the greenback posted several losses after a labor market report indicated that unemployment claims in the United States (US) rose above estimates. After the data, the consensus amongst investors that the US Federal Reserve (Fed) will skip increasing rates at the June meeting weakened the US Dollar. The US Dollar Index (DXY) is down 0.67%, at 103.347.
WTI remains neutral to downward bias, yet still below the 20-day Exponential Moving Average (EMA), the first resistance at $71.86. Oil will continue its downtrend past that area and can challenge 2023 year-to-date (YTD) low of $63.61 if sellers claim the May 31 low of $67.08. It should be said that oscillators justify further downside, but if WTI breaks above the 20-day EMA and clears the 50-day EMA at $73.3s5, that could pave the way for further gains.
Technical Levels: Supports and Resistances
XTIUSD currently trading at 70.88 at the time of writing. Pair opened at 72.52 and is trading with a change of -2.26 % .
| Overview | Overview.1 | |
|---|---|---|
| 0 | Today last price | 70.88 |
| 1 | Today Daily Change | -1.64 |
| 2 | Today Daily Change % | -2.26 |
| 3 | Today daily open | 72.52 |
The pair remains strongly bearish on the daily time frame. It trades below the 20 SMA @ 71.65, 50 SMA 74.78, 100 SMA @ 75.47 and 200 SMA @ 78.75.
| Trends | Trends.1 | |
|---|---|---|
| 0 | Daily SMA20 | 71.65 |
| 1 | Daily SMA50 | 74.78 |
| 2 | Daily SMA100 | 75.47 |
| 3 | Daily SMA200 | 78.75 |
The previous day high was 73.27 while the previous day low was 71.11. The daily 38.2% Fib levels comes at 72.44, expected to provide resistance. Similarly, the daily 61.8% fib level is at 71.93, expected to provide resistance.
Note the levels of interest below:
- Pivot support is noted at 71.33, 70.14, 69.18
- Pivot resistance is noted at 73.49, 74.46, 75.65
| Levels | Levels.1 |
|---|---|
| Previous Daily High | 73.27 |
| Previous Daily Low | 71.11 |
| Previous Weekly High | 73.58 |
| Previous Weekly Low | 67.12 |
| Previous Monthly High | 76.61 |
| Previous Monthly Low | 64.31 |
| Daily Fibonacci 38.2% | 72.44 |
| Daily Fibonacci 61.8% | 71.93 |
| Daily Pivot Point S1 | 71.33 |
| Daily Pivot Point S2 | 70.14 |
| Daily Pivot Point S3 | 69.18 |
| Daily Pivot Point R1 | 73.49 |
| Daily Pivot Point R2 | 74.46 |
| Daily Pivot Point R3 | 75.65 |
[/s2If]
Nehcap Expert Advisor
The NEHCAP MT4 EA is high quality professional trading system geared to generate returns without using GRID or martingales. Each trade has strict risk per trade parameter. The pairs under management include EURUSD, GBPUSD, AUDCAD, AUDNZD,GBPAUD, EURAUD, EURCAD, CHFJPY and many more.
The system is trading live: LIVE ACCOUNT TRACKING
You can run it free. Apply for a free trial and track our account. Buy the system or use profit share mechanism to generate returns on your MT4.
Join Our Telegram Group


