#USDJPY @ 138.834 US Initial Jobless Claims tops estimates, toppling ; UST yields tumble. (Pivot Orderbook analysis)
…
This is a premium post.
[s2If !current_user_can(access_s2member_level4)]Please register for FREE REGISTER to read full post below containing analysis. In case of any error or you think you are not able to read the full post below, please email us at support#nehcap.com [lwa][/s2If] [s2If current_user_can(access_s2member_level1)]
- US Initial Jobless Claims tops estimates, toppling USD/JPY; UST yields tumble.
- Japan’s economy outperforms with 2.7% GDP; technical recession avoided.
- Investors eye June 13 US inflation figures, Fed meeting amid USD dynamics.
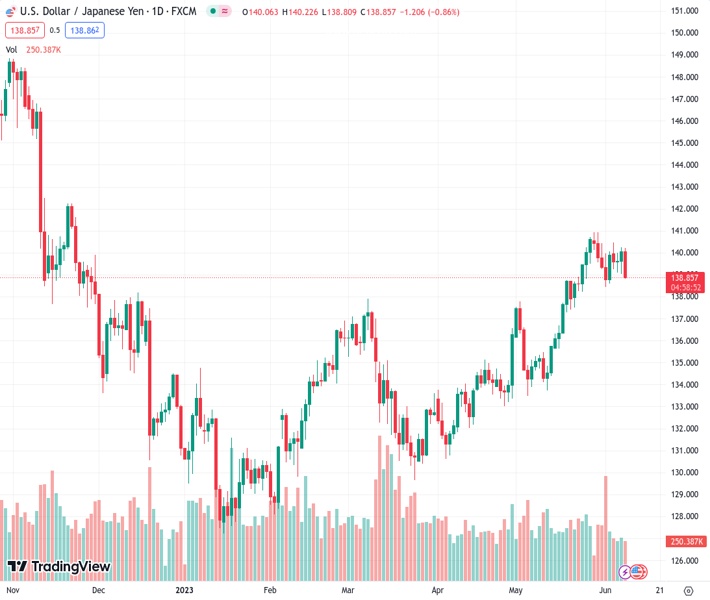
The pair currently trades last at 138.834.
The previous day high was 140.25 while the previous day low was 139.02. The daily 38.2% Fib levels comes at 139.78, expected to provide resistance. Similarly, the daily 61.8% fib level is at 139.49, expected to provide resistance.
USD/JPY dropped close to 0.70% on Thursday after a jobs report portraying the labor market is easing in the United States (US), which justifies the US Federal Reserve (Fed) skip stance for June’s monetary policy meeting. After hitting a daily high of 140.22, the USD/JPY is trading at 139.13 at the time of writing.
Wall Street trades with gains while tumbling US Treasury bond yields, bolstering the Japanese Yen (JPY), which found renewed life and is appreciating against most G8 FX currencies. The US Bureau of Labor Statistics (BLS) stated that unemployment claims for the last week rose above estimates of 232K and reached 261K, its highest level since October 2021. The same data revealed that Continuing Claims fell by 37K to 1.757 M during the week ending May 27.
The USD/JPY dropped after the release, following the direction of the US 10-year Treasury bond yield, which dropped six and a half basis points (bps) as traders began to price in the first Fed pause after the data. At the same time, the US Dollar Index (DXY), which measures the buck’s performance against a basket of currencies, drops 0.60%, at 103.395, below its 20-day Exponential Moving Average (EMA).
On the Japanese front, its economy grew above than initially thought in the first quarter, with GDP coming at 2.7% YoY, vs. forecasts of 1.9%, showing the Japanese economy is developing more resilient than its global counterparts. Notably, data revised out a technical recession as 2022 Q4 was upward revised to 0.4% QoQ. It should be said that growth was driven by inventories, a sign that demand is decelerating.
Upcoming events
The US economic agenda would reveal the latest inflation figures on June 13, when the Federal Reserve begins its two-day meeting to set monetary policy, while a light economic calendar on the Japanese side would lean USD/JPY traders depending on US Dollar dynamics.
USD/JPY consolidates at around the 139.00-140.40 range for the fourth straight day, unable to break above/below the range, though remaining upward biased as shown by the daily moving averages (MAs) staying below the exchange rate. The pullback is about to test the 20-day EMA at 138.64, which, if broken, would extend the pair slide towards May 2 high-turned support at 137.77. For a bullish continuation, the USD/JPY must surpass the 140.00 mark and challenge the weekly high of 140.45.
Technical Levels: Supports and Resistances
USDJPY currently trading at 139.0 at the time of writing. Pair opened at 140.1 and is trading with a change of -0.79 % .
| Overview | Overview.1 | |
|---|---|---|
| 0 | Today last price | 139.00 |
| 1 | Today Daily Change | -1.10 |
| 2 | Today Daily Change % | -0.79 |
| 3 | Today daily open | 140.10 |
The pair remains strongly bullish on the daily timeframe. It trades above its 20 SMA @ 138.6, 50 SMA 135.8, 100 SMA @ 134.3 and 200 SMA @ 137.31.
| Trends | Trends.1 | |
|---|---|---|
| 0 | Daily SMA20 | 138.60 |
| 1 | Daily SMA50 | 135.80 |
| 2 | Daily SMA100 | 134.30 |
| 3 | Daily SMA200 | 137.31 |
The previous day high was 140.25 while the previous day low was 139.02. The daily 38.2% Fib levels comes at 139.78, expected to provide resistance. Similarly, the daily 61.8% fib level is at 139.49, expected to provide resistance.
Note the levels of interest below:
- Pivot support is noted at 139.34, 138.57, 138.12
- Pivot resistance is noted at 140.56, 141.01, 141.78
| Levels | Levels.1 |
|---|---|
| Previous Daily High | 140.25 |
| Previous Daily Low | 139.02 |
| Previous Weekly High | 140.93 |
| Previous Weekly Low | 138.43 |
| Previous Monthly High | 140.93 |
| Previous Monthly Low | 133.50 |
| Daily Fibonacci 38.2% | 139.78 |
| Daily Fibonacci 61.8% | 139.49 |
| Daily Pivot Point S1 | 139.34 |
| Daily Pivot Point S2 | 138.57 |
| Daily Pivot Point S3 | 138.12 |
| Daily Pivot Point R1 | 140.56 |
| Daily Pivot Point R2 | 141.01 |
| Daily Pivot Point R3 | 141.78 |
[/s2If]
Nehcap Expert Advisor
The NEHCAP MT4 EA is high quality professional trading system geared to generate returns without using GRID or martingales. Each trade has strict risk per trade parameter. The pairs under management include EURUSD, GBPUSD, AUDCAD, AUDNZD,GBPAUD, EURAUD, EURCAD, CHFJPY and many more.
The system is trading live: LIVE ACCOUNT TRACKING
You can run it free. Apply for a free trial and track our account. Buy the system or use profit share mechanism to generate returns on your MT4.
Join Our Telegram Group


