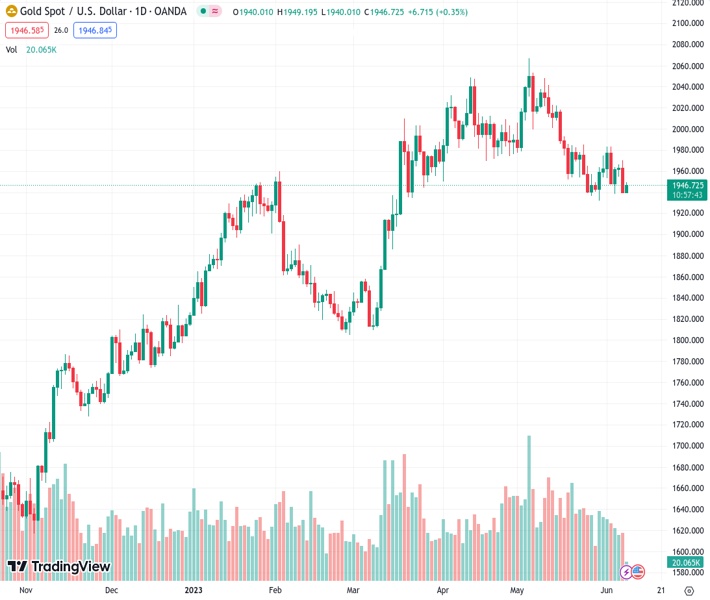
#XAUUSD @ 1,946.44 Gold price has extended its recovery to near $1,950.00 as the USD Index has dropped sharply. (Pivot Orderbook analysis)
…
This is a premium post.
[s2If !current_user_can(access_s2member_level4)]Please register for FREE REGISTER to read full post below containing analysis. In case of any error or you think you are not able to read the full post below, please email us at support#nehcap.com [lwa][/s2If] [s2If current_user_can(access_s2member_level1)]
- Gold price has extended its recovery to near $1,950.00 as the USD Index has dropped sharply.
- Investors have started shrugging off fears associated with expectations of more interest rate hikes by the Fed.
- Gold price is hovering near the upward-sloping trendline of the Ascending Triangle chart pattern.
The pair currently trades last at 1946.44.
The previous day high was 1970.23 while the previous day low was 1939.9. The daily 38.2% Fib levels comes at 1951.49, expected to provide resistance. Similarly, the daily 61.8% fib level is at 1958.64, expected to provide resistance.
Gold price (XAU/USD) attempted a recovery after dropping to near $1,940.00. The precious metal has extended its rebound move to near $1,950.00 as the US Dollar Index (DXY) has dropped sharply. Broader choppiness in the USD Index has kept investors on their toes. An absence of potential triggers this week has bounded the USD Index in a limited territory.
S&P500 futures have recovered their entire losses and have turned positive, showing signs of recovery in the risk appetite of the market participants. It seems that investors have started shrugging off fears associated with expectations of more interest rate hikes by the Federal Reserve (Fed).
The USD Index has found an intermediate support around 103.80, however, the situation for the USD index seems vulnerable as the market sentiment has turned cheerful. In spite of the short-term correction, strength in the USD Index would stay as the Fed is expected to remain hawkish further.
Meanwhile, a survey from Reuters showed that “It would take rate cuts from the Federal Reserve to weaken the currency substantially.” Also, Fed would pause in June for the first time in more than a year and keep its key interest rate at 5.00%-5.25% then and for the rest of the year.
Gold price is hovering near the upward-sloping trendline of the Ascending Triangle chart pattern on a two-hour scale plotted from May 30 low at $1,932.12. The horizontal resistance of the aforementioned pattern is placed from May 19 high at $1,983.29. The precious metal is trading below the 50-period Exponential Moving Average (EMA) at $1,955.38, which indicates that the short-term trend is bearish.
Meanwhile, the Relative Strength Index (RSI) (14) is struggling in holding itself above 40.00.
Technical Levels: Supports and Resistances
XAUUSD currently trading at 1946.43 at the time of writing. Pair opened at 1939.95 and is trading with a change of 0.33 % .
| Overview | Overview.1 | |
|---|---|---|
| 0 | Today last price | 1946.43 |
| 1 | Today Daily Change | 6.48 |
| 2 | Today Daily Change % | 0.33 |
| 3 | Today daily open | 1939.95 |
The pair is trading below its 20 Daily moving average @ 1969.9, below its 50 Daily moving average @ 1990.55 , above its 100 Daily moving average @ 1940.31 and above its 200 Daily moving average @ 1839.01
| Trends | Trends.1 | |
|---|---|---|
| 0 | Daily SMA20 | 1969.90 |
| 1 | Daily SMA50 | 1990.55 |
| 2 | Daily SMA100 | 1940.31 |
| 3 | Daily SMA200 | 1839.01 |
The previous day high was 1970.23 while the previous day low was 1939.9. The daily 38.2% Fib levels comes at 1951.49, expected to provide resistance. Similarly, the daily 61.8% fib level is at 1958.64, expected to provide resistance.
Note the levels of interest below:
- Pivot support is noted at 1929.82, 1919.7, 1899.49
- Pivot resistance is noted at 1960.15, 1980.36, 1990.48
| Levels | Levels.1 |
|---|---|
| Previous Daily High | 1970.23 |
| Previous Daily Low | 1939.90 |
| Previous Weekly High | 1983.50 |
| Previous Weekly Low | 1932.12 |
| Previous Monthly High | 2079.76 |
| Previous Monthly Low | 1932.12 |
| Daily Fibonacci 38.2% | 1951.49 |
| Daily Fibonacci 61.8% | 1958.64 |
| Daily Pivot Point S1 | 1929.82 |
| Daily Pivot Point S2 | 1919.70 |
| Daily Pivot Point S3 | 1899.49 |
| Daily Pivot Point R1 | 1960.15 |
| Daily Pivot Point R2 | 1980.36 |
| Daily Pivot Point R3 | 1990.48 |
[/s2If]
Nehcap Expert Advisor
The NEHCAP MT4 EA is high quality professional trading system geared to generate returns without using GRID or martingales. Each trade has strict risk per trade parameter. The pairs under management include EURUSD, GBPUSD, AUDCAD, AUDNZD,GBPAUD, EURAUD, EURCAD, CHFJPY and many more.
The system is trading live: LIVE ACCOUNT TRACKING
You can run it free. Apply for a free trial and track our account. Buy the system or use profit share mechanism to generate returns on your MT4.
Join Our Telegram Group


