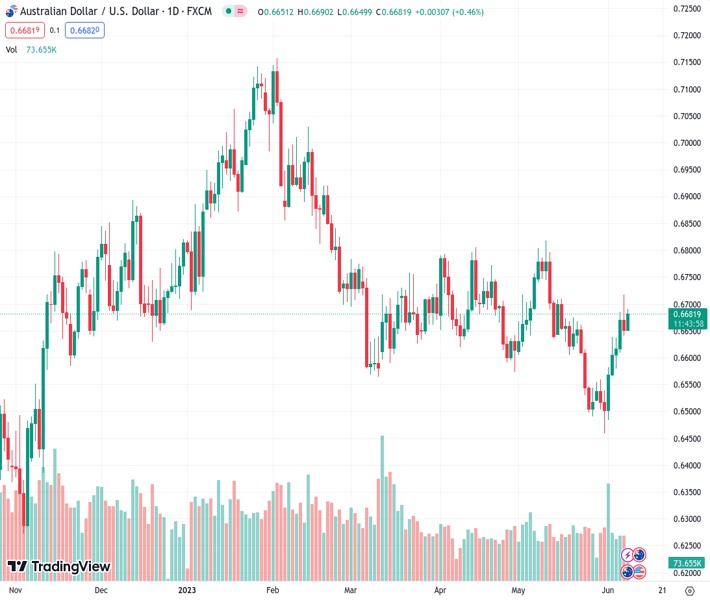
#AUDUSD @ 0.66809 is marching towards 0.6700 as the RBA is expected to push rates to 4.35%. (Pivot Orderbook analysis)
…
This is a premium post.
[s2If !current_user_can(access_s2member_level4)]Please register for FREE REGISTER to read full post below containing analysis. In case of any error or you think you are not able to read the full post below, please email us at support#nehcap.com [lwa][/s2If] [s2If current_user_can(access_s2member_level1)]
- AUD/USD is marching towards 0.6700 as the RBA is expected to push rates to 4.35%.
- The USD Index is expected to remain sideways as investors are awaiting the release of the US CPI.
- AUD/USD witnessed responsive buying despite delivering a breakdown of the consolidation.
The pair currently trades last at 0.66809.
The previous day high was 0.6717 while the previous day low was 0.6642. The daily 38.2% Fib levels comes at 0.6671, expected to provide support. Similarly, the daily 61.8% fib level is at 0.6688, expected to provide resistance.
The AUD/USD pair has extended its recovery and is marching toward the round-level resistance of 0.6700 in the European session. The Aussie asset has resumed its upside journey as the US Dollar Index (DXY) has extended its downside.
On a broader note, the USD Index is expected to remain sideways as investors are awaiting the release of the United States Consumer Price Index (CPI) for further action.
The Australian Dollar has gained strength as the street is anticipating that the Reserve Bank of Australia (RBA) will keep raising interest rates further despite deteriorating Australian economic prospects. A poll from Reuters showed that the RBA would raise its Official Cash Rate (OCR) further by 25 basis points (bps) to 4.35%.
AUD/USD witnessed responsive buying despite delivering a breakdown of the consolidation formed in a range of 0.6563-0.6808 on a daily scale. Lack of follow-up selling in the Aussie asset after a consolidation breakdown triggered a solid recovery. A responsive buying move indicates that investors considered the asset a value bet.
The Aussie asset has climbed above the 20-period Exponential Moving Average (EMA) at 0.6607, which indicates that the short-term trend has turned bullish.
Meanwhile, the Relative Strength Index (RSI) (14) has rebounded into the 40.00-60.00 range from the bearish range of 20.00-40.00, which indicates that the downside momentum has receded.
Should the Aussie asset breaks above June 07 high at 0.6718, the Australian Dollar bulls will drive the asset toward April 18 high at 0.6748 followed by May 10 high at 0.6818.
On the flip side, if the Aussie asset breaks below June 01 low at 0.6484, US Dollar bulls would drag the asset to 01 November 2022 high around 0.6464 followed by the round-level support at 0.6400.
Technical Levels: Supports and Resistances
AUDUSD currently trading at 0.6687 at the time of writing. Pair opened at 0.6652 and is trading with a change of 0.53 % .
| Overview | Overview.1 | |
|---|---|---|
| 0 | Today last price | 0.6687 |
| 1 | Today Daily Change | 0.0035 |
| 2 | Today Daily Change % | 0.5300 |
| 3 | Today daily open | 0.6652 |
The pair is trading above its 20 Daily moving average @ 0.6607, above its 50 Daily moving average @ 0.6662 , below its 100 Daily moving average @ 0.6745 and below its 200 Daily moving average @ 0.6692
| Trends | Trends.1 | |
|---|---|---|
| 0 | Daily SMA20 | 0.6607 |
| 1 | Daily SMA50 | 0.6662 |
| 2 | Daily SMA100 | 0.6745 |
| 3 | Daily SMA200 | 0.6692 |
The previous day high was 0.6717 while the previous day low was 0.6642. The daily 38.2% Fib levels comes at 0.6671, expected to provide support. Similarly, the daily 61.8% fib level is at 0.6688, expected to provide resistance.
Note the levels of interest below:
- Pivot support is noted at 0.6623, 0.6595, 0.6548
- Pivot resistance is noted at 0.6699, 0.6746, 0.6775
| Levels | Levels.1 |
|---|---|
| Previous Daily High | 0.6717 |
| Previous Daily Low | 0.6642 |
| Previous Weekly High | 0.6639 |
| Previous Weekly Low | 0.6458 |
| Previous Monthly High | 0.6818 |
| Previous Monthly Low | 0.6458 |
| Daily Fibonacci 38.2% | 0.6671 |
| Daily Fibonacci 61.8% | 0.6688 |
| Daily Pivot Point S1 | 0.6623 |
| Daily Pivot Point S2 | 0.6595 |
| Daily Pivot Point S3 | 0.6548 |
| Daily Pivot Point R1 | 0.6699 |
| Daily Pivot Point R2 | 0.6746 |
| Daily Pivot Point R3 | 0.6775 |
[/s2If]
Nehcap Expert Advisor
The NEHCAP MT4 EA is high quality professional trading system geared to generate returns without using GRID or martingales. Each trade has strict risk per trade parameter. The pairs under management include EURUSD, GBPUSD, AUDCAD, AUDNZD,GBPAUD, EURAUD, EURCAD, CHFJPY and many more.
The system is trading live: LIVE ACCOUNT TRACKING
You can run it free. Apply for a free trial and track our account. Buy the system or use profit share mechanism to generate returns on your MT4.
Join Our Telegram Group


