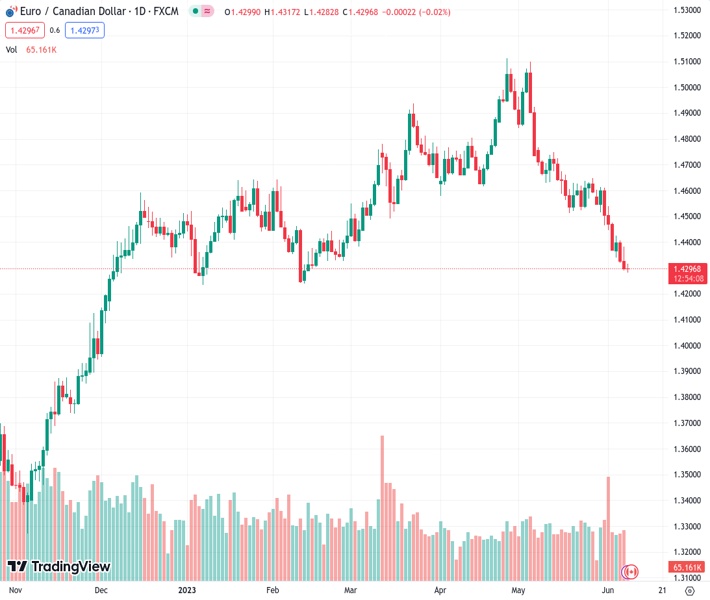
#EURCAD @ 1.42962 drifts lower for the third successive day and drops to a nearly three-month low. (Pivot Orderbook analysis)
…
This is a premium post.
[s2If !current_user_can(access_s2member_level4)]Please register for FREE REGISTER to read full post below containing analysis. In case of any error or you think you are not able to read the full post below, please email us at support#nehcap.com [lwa][/s2If] [s2If current_user_can(access_s2member_level1)]
- EUR/CAD drifts lower for the third successive day and drops to a nearly three-month low.
- The BoC’s surprise rate hike, an uptick in Oil prices underpin the Loonie and exert pressure.
- Bets for further policy tightening by the ECB could limit losses amid a slightly oversold RSI.
The pair currently trades last at 1.42962.
The previous day high was 1.4382 while the previous day low was 1.429. The daily 38.2% Fib levels comes at 1.4326, expected to provide resistance. Similarly, the daily 61.8% fib level is at 1.4347, expected to provide resistance.
The EUR/CAD cross prolongs its recent downtrend witnessed over the past week or so and remains under some selling pressure for the third straight day on Thursday – also marking the sixth day of a negative move in the previous seven. The cross maintains its offered tone through the early European session and drops to the 1.4285-1.4280 region, its lowest level since February 13 in the last hour.
Against the backdrop of the Bank of Canada’s (BoC) surprise 25 bps rate hike on Wednesday, a modest uptick in Crude Oil prices is seen underpinning the commodity-linked Loonie and exerting some pressure on the EUR/CAD cross. It is worth recalling that the Canadian central bank defied market expectations by restarting its policy tightening and hiking its overnight rate to 4.75%, or a 22-year high.
In the accompanying policy statement, the BoC noted that concerns have increased that CPI could get stuck materially above the 2% target. The markets were quick to price in yet another increase next month to ratchet down an overheating economy and stubbornly high inflation. The hawkish outlook contributes to the Canadian Dollar’s (CAD) relative outperformance and weighs on the EUR/CAD cross.
The shared currency (Euro), on the other hand, draws some support from a modest US Dollar (USD) downtick and rising bets for further policy tightening by the European Central Bank (ECB). In fact, ECB President Christine Lagarde indicated earlier this week that additional interest rate rises were likely as, so far, there was no clear evidence that underlying inflation has peaked.
This comes on the back of the recent hawkish comments by several ECB officials and reaffirms expectations that the central bank is not done raising rates despite a fall in consumer inflation. It is worth recalling that the headline Eurozone CPI decelerated more than anticipated to the 6.1% YoY rate in May from 7.0% previous. Moreover, Core CPI slowed from 5.6% YoY to 5.3% last month.
The aforementioned mixed fundamental backdrop, along with the fact that the Relative Strength Index (RSI) on the daily chart is on the verge of breaking into the oversold territory, warrant some caution for bearish traders. Hence, it will be prudent to wait for some near-term consolidation or a modest bounce before positioning for a further depreciating move for the EUR/CAD cross.
Technical Levels: Supports and Resistances
EURCAD currently trading at 1.4291 at the time of writing. Pair opened at 1.4304 and is trading with a change of -0.09 % .
| Overview | Overview.1 | |
|---|---|---|
| 0 | Today last price | 1.4291 |
| 1 | Today Daily Change | -0.0013 |
| 2 | Today Daily Change % | -0.0900 |
| 3 | Today daily open | 1.4304 |
The pair is trading below its 20 Daily moving average @ 1.4549, below its 50 Daily moving average @ 1.4694 , below its 100 Daily moving average @ 1.4611 and above its 200 Daily moving average @ 1.4202
| Trends | Trends.1 | |
|---|---|---|
| 0 | Daily SMA20 | 1.4549 |
| 1 | Daily SMA50 | 1.4694 |
| 2 | Daily SMA100 | 1.4611 |
| 3 | Daily SMA200 | 1.4202 |
The previous day high was 1.4382 while the previous day low was 1.429. The daily 38.2% Fib levels comes at 1.4326, expected to provide resistance. Similarly, the daily 61.8% fib level is at 1.4347, expected to provide resistance.
Note the levels of interest below:
- Pivot support is noted at 1.4269, 1.4234, 1.4177
- Pivot resistance is noted at 1.4361, 1.4417, 1.4452
| Levels | Levels.1 |
|---|---|
| Previous Daily High | 1.4382 |
| Previous Daily Low | 1.4290 |
| Previous Weekly High | 1.4614 |
| Previous Weekly Low | 1.4371 |
| Previous Monthly High | 1.5099 |
| Previous Monthly Low | 1.4465 |
| Daily Fibonacci 38.2% | 1.4326 |
| Daily Fibonacci 61.8% | 1.4347 |
| Daily Pivot Point S1 | 1.4269 |
| Daily Pivot Point S2 | 1.4234 |
| Daily Pivot Point S3 | 1.4177 |
| Daily Pivot Point R1 | 1.4361 |
| Daily Pivot Point R2 | 1.4417 |
| Daily Pivot Point R3 | 1.4452 |
[/s2If]
Nehcap Expert Advisor
The NEHCAP MT4 EA is high quality professional trading system geared to generate returns without using GRID or martingales. Each trade has strict risk per trade parameter. The pairs under management include EURUSD, GBPUSD, AUDCAD, AUDNZD,GBPAUD, EURAUD, EURCAD, CHFJPY and many more.
The system is trading live: LIVE ACCOUNT TRACKING
You can run it free. Apply for a free trial and track our account. Buy the system or use profit share mechanism to generate returns on your MT4.
Join Our Telegram Group


