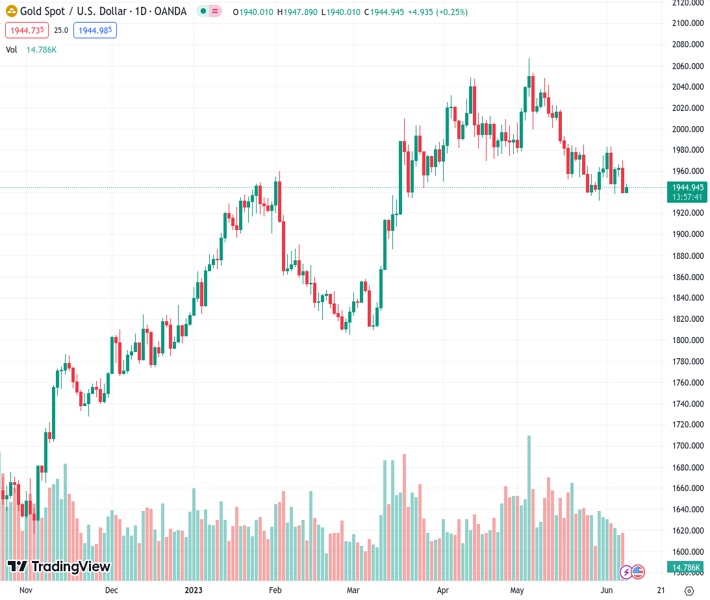
#XAUUSD @ 1,944.84 Gold price has dropped firmly after failing to tap the $1,950.00 resistance amid a recovery in hawkish Fed bets. (Pivot Orderbook analysis)
…
This is a premium post.
[s2If !current_user_can(access_s2member_level4)]Please register for FREE REGISTER to read full post below containing analysis. In case of any error or you think you are not able to read the full post below, please email us at support#nehcap.com [lwa][/s2If] [s2If current_user_can(access_s2member_level1)]
- Gold price has dropped firmly after failing to tap the $1,950.00 resistance amid a recovery in hawkish Fed bets.
- S&P500 futures have recovered some of their losses added in Asia, however, the overall market mood is still cautious.
- US Yellen believes that inflation can be arrested while maintaining an upbeat labor market.
The pair currently trades last at 1944.84.
The previous day high was 1970.23 while the previous day low was 1939.9. The daily 38.2% Fib levels comes at 1951.49, expected to provide resistance. Similarly, the daily 61.8% fib level is at 1958.64, expected to provide resistance.
Gold price (XAU/USD) has witnessed a steep fall after failing to kiss the crucial resistance of $1,950.00 in the European session. The precious metal has attracted significant offers as the corrective move in the US Dollar Index (DXY) seems concluded due to an improvement in odds for the continuation of the rate-hiking spell by the Federal Reserve (Fed).
S&P500 futures have recovered some of their losses added in Asia, however, the overall market mood is still cautious as investors are worried that more interest rate hikes by the Fed would worsen the economic outlook.
US Treasury Secretary Janet Yellen stated on Wednesday that robust consumer spending has kept the United States economy resilient. She feels that inflation can be arrested while maintaining an upbeat labor market, with unemployment in the 4% range, up slightly from the 3.7% reading in May, as reported by Reuters.
The odds for one more interest rate hike from the Fed rebounded after former Richmond Fed President Jeffrey Lacker cited current interest rates at 5.0-5.25% should rise to 6% in order to bring down sticky inflation.
The USD Index is expected to remain choppy as the economic calendar has nothing much to offer this week. Economists at MUFG believe that consolidation at these stronger US Dollar levels seems most likely given the probable declining appetite for position-taking ahead of a key week next week with the US Consumer Price Index (CPI) data and the FOMC and European Central Bank (ECB) meetings.
Gold price has formed a textbook-traced Darvas Box chart pattern on a four-hour scale, which indicates a volatility contraction, followed by a one-way move. The precious metal is consolidating in a range of $1,932-1,985 for the past three weeks. Broadly, horizontal support is plotted from March 15 high at $1,937.39.
The magical 200-period Exponential Moving Average (EMA) at $1,975.47 is acting as a strong barrier for the Gold bulls.
The Relative Strength Index (RSI) (14) is hovering near 40.00 and a break below the same will trigger the bearish momentum.
Technical Levels: Supports and Resistances
XAUUSD currently trading at 1943.24 at the time of writing. Pair opened at 1939.95 and is trading with a change of 0.17 % .
| Overview | Overview.1 | |
|---|---|---|
| 0 | Today last price | 1943.24 |
| 1 | Today Daily Change | 3.29 |
| 2 | Today Daily Change % | 0.17 |
| 3 | Today daily open | 1939.95 |
The pair is trading below its 20 Daily moving average @ 1969.9, below its 50 Daily moving average @ 1990.55 , above its 100 Daily moving average @ 1940.31 and above its 200 Daily moving average @ 1839.01
| Trends | Trends.1 | |
|---|---|---|
| 0 | Daily SMA20 | 1969.90 |
| 1 | Daily SMA50 | 1990.55 |
| 2 | Daily SMA100 | 1940.31 |
| 3 | Daily SMA200 | 1839.01 |
The previous day high was 1970.23 while the previous day low was 1939.9. The daily 38.2% Fib levels comes at 1951.49, expected to provide resistance. Similarly, the daily 61.8% fib level is at 1958.64, expected to provide resistance.
Note the levels of interest below:
- Pivot support is noted at 1929.82, 1919.7, 1899.49
- Pivot resistance is noted at 1960.15, 1980.36, 1990.48
| Levels | Levels.1 |
|---|---|
| Previous Daily High | 1970.23 |
| Previous Daily Low | 1939.90 |
| Previous Weekly High | 1983.50 |
| Previous Weekly Low | 1932.12 |
| Previous Monthly High | 2079.76 |
| Previous Monthly Low | 1932.12 |
| Daily Fibonacci 38.2% | 1951.49 |
| Daily Fibonacci 61.8% | 1958.64 |
| Daily Pivot Point S1 | 1929.82 |
| Daily Pivot Point S2 | 1919.70 |
| Daily Pivot Point S3 | 1899.49 |
| Daily Pivot Point R1 | 1960.15 |
| Daily Pivot Point R2 | 1980.36 |
| Daily Pivot Point R3 | 1990.48 |
[/s2If]
Nehcap Expert Advisor
The NEHCAP MT4 EA is high quality professional trading system geared to generate returns without using GRID or martingales. Each trade has strict risk per trade parameter. The pairs under management include EURUSD, GBPUSD, AUDCAD, AUDNZD,GBPAUD, EURAUD, EURCAD, CHFJPY and many more.
The system is trading live: LIVE ACCOUNT TRACKING
You can run it free. Apply for a free trial and track our account. Buy the system or use profit share mechanism to generate returns on your MT4.
Join Our Telegram Group


