#USDCHF @ 0.90977 holds lower ground at intraday low during the first loss-making day in three., @nehcap view: Limited downside expected (Pivot Orderbook analysis)
…
This is a premium post.
[s2If !current_user_can(access_s2member_level4)]Please register for FREE REGISTER to read full post below containing analysis. In case of any error or you think you are not able to read the full post below, please email us at support#nehcap.com [lwa][/s2If] [s2If current_user_can(access_s2member_level1)]
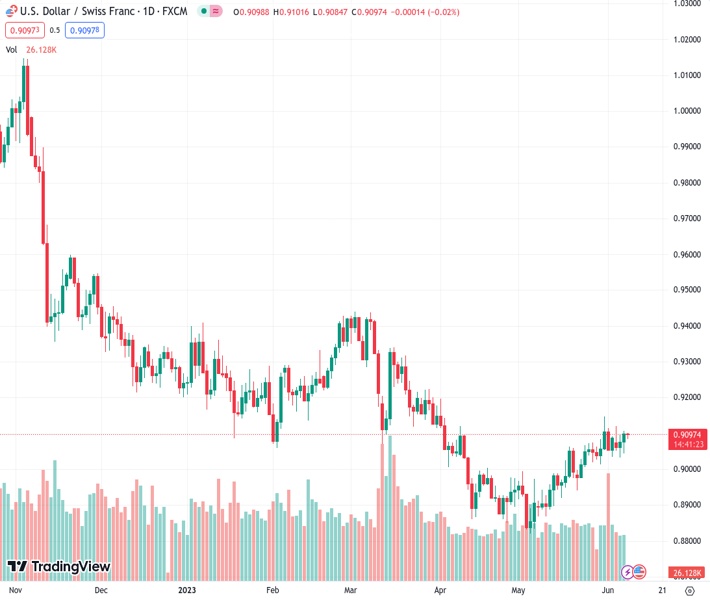
- USD/CHF holds lower ground at intraday low during the first loss-making day in three.
- Overbought RSI, looming bear cross on MACD triggered Swiss Franc pair’s fall.
- Convergence of 100-HMA, previous resistance line challenges bears.
The pair currently trades last at 0.90977.
The previous day high was 0.9107 while the previous day low was 0.9043. The daily 38.2% Fib levels comes at 0.9083, expected to provide support. Similarly, the daily 61.8% fib level is at 0.9068, expected to provide support.
USD/CHF remains pressured around the intraday low near 0.9090, despite the latest corrective bounce off the day’s low heading into Thursday’s European session. In doing so, the Swiss Franc (CHF) pair drops for the first day in three.
While tracing the catalysts for the quote’s latest weakness, the RSI (14) line’s retreat from the overbought territory and previously looming bear cross on MACD, now confirmed, gain major attention.
However, the bullish triangle breakout keeps the USD/CHF pair buyers hopeful unless the quote drops back below the one-week-old descending triangle’s top line, now immediate support near 0.9075. Adding strength to the 0.9075 support is the 100-Hour Moving Average (HMA).
Should the pair slide beneath the 0.9075 support confluence, it can quickly challenge the double bottoms marked around 0.9035-30, forming part of the aforementioned triangle.
On the contrary, the USD/CHF pair’s recovery moves need to refresh the weekly top, currently around 0.9110, to convince bulls for more upside runs, even if they hold the reins.
Even so, a one-week-old horizontal resistance area surrounding 0.9115-20 can act as the last defense of the USD/CHF pair sellers.
Overall, USD/CHF remains on the bull’s radar despite snapping a two-day winning streak.
Trend: Limited downside expected
Technical Levels: Supports and Resistances
USDCHF currently trading at 0.9089 at the time of writing. Pair opened at 0.9102 and is trading with a change of -0.14 % .
| Overview | Overview.1 | |
|---|---|---|
| 0 | Today last price | 0.9089 |
| 1 | Today Daily Change | -0.0013 |
| 2 | Today Daily Change % | -0.1400 |
| 3 | Today daily open | 0.9102 |
The pair is trading above its 20 Daily moving average @ 0.9031, above its 50 Daily moving average @ 0.8994 , below its 100 Daily moving average @ 0.9123 and below its 200 Daily moving average @ 0.9366
| Trends | Trends.1 | |
|---|---|---|
| 0 | Daily SMA20 | 0.9031 |
| 1 | Daily SMA50 | 0.8994 |
| 2 | Daily SMA100 | 0.9123 |
| 3 | Daily SMA200 | 0.9366 |
The previous day high was 0.9107 while the previous day low was 0.9043. The daily 38.2% Fib levels comes at 0.9083, expected to provide support. Similarly, the daily 61.8% fib level is at 0.9068, expected to provide support.
Note the levels of interest below:
- Pivot support is noted at 0.9061, 0.902, 0.8997
- Pivot resistance is noted at 0.9125, 0.9148, 0.9189
| Levels | Levels.1 |
|---|---|
| Previous Daily High | 0.9107 |
| Previous Daily Low | 0.9043 |
| Previous Weekly High | 0.9148 |
| Previous Weekly Low | 0.9014 |
| Previous Monthly High | 0.9148 |
| Previous Monthly Low | 0.8820 |
| Daily Fibonacci 38.2% | 0.9083 |
| Daily Fibonacci 61.8% | 0.9068 |
| Daily Pivot Point S1 | 0.9061 |
| Daily Pivot Point S2 | 0.9020 |
| Daily Pivot Point S3 | 0.8997 |
| Daily Pivot Point R1 | 0.9125 |
| Daily Pivot Point R2 | 0.9148 |
| Daily Pivot Point R3 | 0.9189 |
[/s2If]
Nehcap Expert Advisor
The NEHCAP MT4 EA is high quality professional trading system geared to generate returns without using GRID or martingales. Each trade has strict risk per trade parameter. The pairs under management include EURUSD, GBPUSD, AUDCAD, AUDNZD,GBPAUD, EURAUD, EURCAD, CHFJPY and many more.
The system is trading live: LIVE ACCOUNT TRACKING
You can run it free. Apply for a free trial and track our account. Buy the system or use profit share mechanism to generate returns on your MT4.
Join Our Telegram Group


