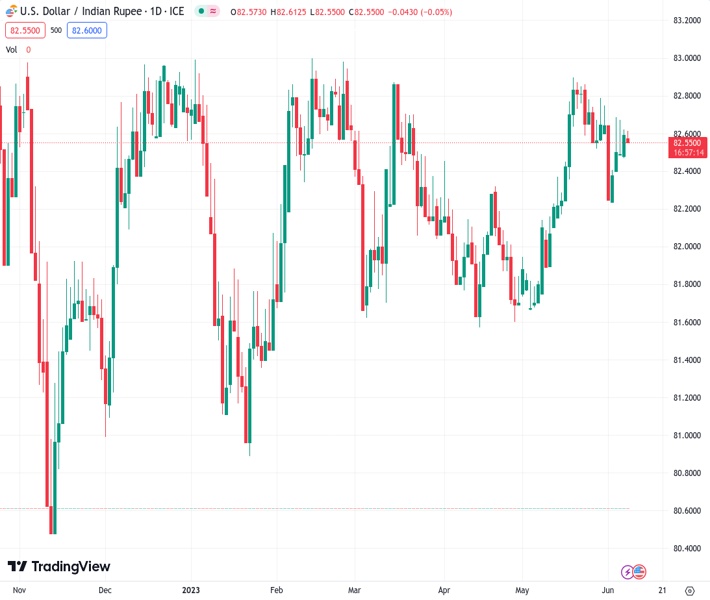
#USDINR @ 82.5625 grinds lower while keeping the daily loss after RBI’s inaction. (Pivot Orderbook analysis)
…
This is a premium post.
[s2If !current_user_can(access_s2member_level4)]Please register for FREE REGISTER to read full post below containing analysis. In case of any error or you think you are not able to read the full post below, please email us at support#nehcap.com [lwa][/s2If] [s2If current_user_can(access_s2member_level1)]
- USD/INR grinds lower while keeping the daily loss after RBI’s inaction.
- RBI keeps benchmark Repo rate unchanged at 6.5%, as expected.
- Mixed global growth, Fed concerns prod sentiment in Asia-Pacific zone, putting a floor under US Dollar price.
- Risk catalysts eyed for short-term directions ahead of next week’s FOMC.
The pair currently trades last at 82.5625.
The previous day high was 82.6581 while the previous day low was 82.4625. The daily 38.2% Fib levels comes at 82.5834, expected to provide resistance. Similarly, the daily 61.8% fib level is at 82.5372, expected to provide support.
USD/INR justifies the Reserve Bank of India (RBI) inaction during early Thursday as it reverses the initial losses around 82.60 after the Indian central bank’s monetary policy decision. In doing so, the Indian Rupee (INR) fails to justify the US Dollar’s weakness amid mixed market sentiment.
RBI keeps the benchmark Repo rate unchanged at 6.5% by matching market forecasts after June’s monetary policy meeting. Following the interest rate announcements, RBI Governor Shaktikanta Das said, “We can derive satisfaction that Indian eco and financial sector stand robust in global environment,” The policymaker also added that the path ahead is now somewhat clearer.
On the other hand, fears of global economic slowdown backed by higher rates weigh on the sentiment, even if the mixed Fed concerns and sluggish yields allow markets to remain slightly positive. That said, the latest increase in the market’s bets on the Federal Reserve’s 25 bps rate hike in July, even as the June Federal Open Market Committee (FOMC) is likely to keep the rates unchanged, propel the USD/INR price even as the US Dollar struggles of late.
Elsewhere, optimism surrounding China and downbeat Oil price allow the USD/INR to consolidate the weekly loss.
A slew of Chinese state banks including the Industrial and Commercial Bank of China, Bank of China and Construction Bank cut their benchmark rates. The same raises speculations that the Chinese central bank, namely the People’s Bank of China (PBOC), will also cut the rates. Further, China’s Director of China’s National Administration of Financial Regulation Li Yunze recently mentioned that the economy is still recovering.
It should be noted that the WTI crude oil prints mild losses near $72.50 while failing to extend the previous day’s corrective bounce, eyes the second consecutive weekly loss.
To sum up, USD/INR justifies the RBI’s inaction by paring weekly gain. However, the quote’s further moves appear limited due to a light calendar and cautious mood ahead of the next week’s FOMC monetary policy meeting.
A daily closing beyond a two-week-old resistance line, now immediate support around 82.53, keeps USD/INR buyers hopeful of witnessing further upside toward the previous monthly high of around 83.00 round figure.
Technical Levels: Supports and Resistances
USDINR currently trading at 82.6015 at the time of writing. Pair opened at 82.6386 and is trading with a change of -0.04% % .
| Overview | Overview.1 | |
|---|---|---|
| 0 | Today last price | 82.6015 |
| 1 | Today Daily Change | -0.0371 |
| 2 | Today Daily Change % | -0.04% |
| 3 | Today daily open | 82.6386 |
The pair remains strongly bullish on the daily timeframe. It trades above its 20 SMA @ 82.5535, 50 SMA 82.1811, 100 SMA @ 82.2266 and 200 SMA @ 81.9652.
| Trends | Trends.1 | |
|---|---|---|
| 0 | Daily SMA20 | 82.5535 |
| 1 | Daily SMA50 | 82.1811 |
| 2 | Daily SMA100 | 82.2266 |
| 3 | Daily SMA200 | 81.9652 |
The previous day high was 82.6581 while the previous day low was 82.4625. The daily 38.2% Fib levels comes at 82.5834, expected to provide resistance. Similarly, the daily 61.8% fib level is at 82.5372, expected to provide support.
Note the levels of interest below:
- Pivot support is noted at 82.5147, 82.3908, 82.3191
- Pivot resistance is noted at 82.7103, 82.782, 82.9059
| Levels | Levels.1 |
|---|---|
| Previous Daily High | 82.6581 |
| Previous Daily Low | 82.4625 |
| Previous Weekly High | 82.8046 |
| Previous Weekly Low | 82.2615 |
| Previous Monthly High | 82.9810 |
| Previous Monthly Low | 81.6435 |
| Daily Fibonacci 38.2% | 82.5834 |
| Daily Fibonacci 61.8% | 82.5372 |
| Daily Pivot Point S1 | 82.5147 |
| Daily Pivot Point S2 | 82.3908 |
| Daily Pivot Point S3 | 82.3191 |
| Daily Pivot Point R1 | 82.7103 |
| Daily Pivot Point R2 | 82.7820 |
| Daily Pivot Point R3 | 82.9059 |
[/s2If]
Nehcap Expert Advisor
The NEHCAP MT4 EA is high quality professional trading system geared to generate returns without using GRID or martingales. Each trade has strict risk per trade parameter. The pairs under management include EURUSD, GBPUSD, AUDCAD, AUDNZD,GBPAUD, EURAUD, EURCAD, CHFJPY and many more.
The system is trading live: LIVE ACCOUNT TRACKING
You can run it free. Apply for a free trial and track our account. Buy the system or use profit share mechanism to generate returns on your MT4.
Join Our Telegram Group


