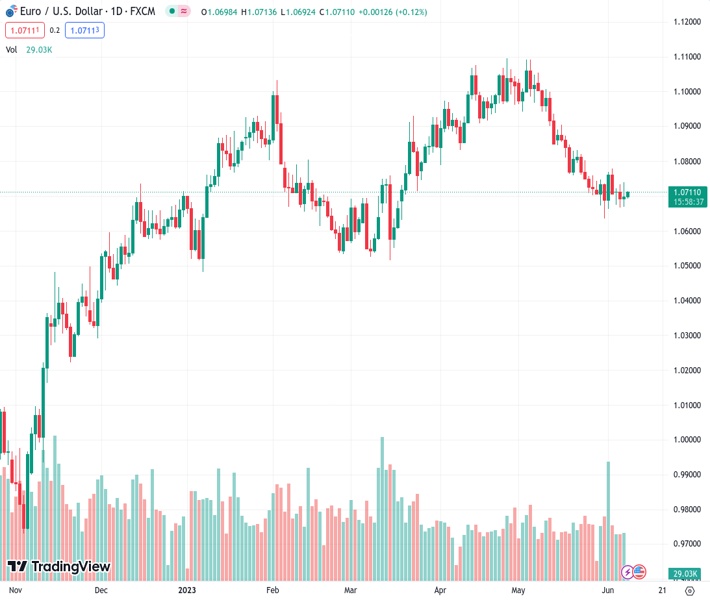
#EURUSD @ 1.07121 edges higher and retakes the 1.0700 mark during the Asian session on Thursday. (Pivot Orderbook analysis)
…
This is a premium post.
[s2If !current_user_can(access_s2member_level4)]Please register for FREE REGISTER to read full post below containing analysis. In case of any error or you think you are not able to read the full post below, please email us at support#nehcap.com [lwa][/s2If] [s2If current_user_can(access_s2member_level1)]
- EUR/USD edges higher and retakes the 1.0700 mark during the Asian session on Thursday.
- A mildly softer tone around the USD is seen as a key factor lending support to the major.
- The formation of a bearish pennant warrants caution before positioning for further gains.
The pair currently trades last at 1.07121.
The previous day high was 1.074 while the previous day low was 1.0668. The daily 38.2% Fib levels comes at 1.0713, expected to provide resistance. Similarly, the daily 61.8% fib level is at 1.0696, expected to provide support.
The EUR/USD pair attracts some buying following the overnight pullback from the weekly high and climbs back above the 1.0700 mark during the Asian session on Thursday.
The uncertainty over the Federal Reserve’s (Fed) rate-hike path keeps the US Dollar (USD) bulls on the defensive, which, in turn, is seen lending some support to the EUR/USD pair. That said, surprise rate hikes by the Reserve Bank of Australia (RBA) and the Bank of Canada (BoC) this week suggest that the fight against inflation is not over yet. This supports prospects for a further policy tightening by the Fed, which remains supportive of elevated US Treasury bond yields and favours the USD bulls.
From a technical perspective, the recent price action between two converging trend lines constitutes the formation of a bearish pennant on hourly charts. This comes on the back of the recent breakdown through the 100-day Simple Moving Average (SMA) and suggests that the path of least resistance for the EUR/USD pair is to the downside. Bearish traders, however, need to wait for weakness below the symmetrical triangle support, currently near the 1.0680-1.0675 region, before placing fresh bets.
The latter is followed by the 1.0635 area, or over a two-month low touched last week, and the 1.0600 round-figure mark. Some follow-through selling will be seen as a fresh trigger for bearish traders and drag the EUR/USD pair towards intermediate support near the 1.0540-1.0535 area en route to the 1.0500 psychological mark. The latter coincides with the very important 200-day SMA and should help protect any further losses ahead of the highly-anticipated FOMC meeting next week.
On the flip side, the top end of the aforementioned symmetrical triangle, currently around the 1.0745-1.0750 area, coincides with the 100-period SMA on the 4-hour chart. A convincing breakthrough could trigger a short-covering rally and allow the EUR/USD pair to reclaim the 1.0800 mark. The upward trajectory could get extended further towards testing the next relevant hurdle near the 1.0865-1.0870 region, representing the 200-period SMA on the 4-hour chart.
Technical Levels: Supports and Resistances
EURUSD currently trading at 1.071 at the time of writing. Pair opened at 1.0699 and is trading with a change of 0.1 % .
| Overview | Overview.1 | |
|---|---|---|
| 0 | Today last price | 1.0710 |
| 1 | Today Daily Change | 0.0011 |
| 2 | Today Daily Change % | 0.1000 |
| 3 | Today daily open | 1.0699 |
The pair is trading below its 20 Daily moving average @ 1.077, below its 50 Daily moving average @ 1.0889 , below its 100 Daily moving average @ 1.081 and above its 200 Daily moving average @ 1.0512
| Trends | Trends.1 | |
|---|---|---|
| 0 | Daily SMA20 | 1.0770 |
| 1 | Daily SMA50 | 1.0889 |
| 2 | Daily SMA100 | 1.0810 |
| 3 | Daily SMA200 | 1.0512 |
The previous day high was 1.074 while the previous day low was 1.0668. The daily 38.2% Fib levels comes at 1.0713, expected to provide resistance. Similarly, the daily 61.8% fib level is at 1.0696, expected to provide support.
Note the levels of interest below:
- Pivot support is noted at 1.0665, 1.0631, 1.0593
- Pivot resistance is noted at 1.0736, 1.0774, 1.0808
| Levels | Levels.1 |
|---|---|
| Previous Daily High | 1.0740 |
| Previous Daily Low | 1.0668 |
| Previous Weekly High | 1.0779 |
| Previous Weekly Low | 1.0635 |
| Previous Monthly High | 1.1092 |
| Previous Monthly Low | 1.0635 |
| Daily Fibonacci 38.2% | 1.0713 |
| Daily Fibonacci 61.8% | 1.0696 |
| Daily Pivot Point S1 | 1.0665 |
| Daily Pivot Point S2 | 1.0631 |
| Daily Pivot Point S3 | 1.0593 |
| Daily Pivot Point R1 | 1.0736 |
| Daily Pivot Point R2 | 1.0774 |
| Daily Pivot Point R3 | 1.0808 |
[/s2If]
Nehcap Expert Advisor
The NEHCAP MT4 EA is high quality professional trading system geared to generate returns without using GRID or martingales. Each trade has strict risk per trade parameter. The pairs under management include EURUSD, GBPUSD, AUDCAD, AUDNZD,GBPAUD, EURAUD, EURCAD, CHFJPY and many more.
The system is trading live: LIVE ACCOUNT TRACKING
You can run it free. Apply for a free trial and track our account. Buy the system or use profit share mechanism to generate returns on your MT4.
Join Our Telegram Group


