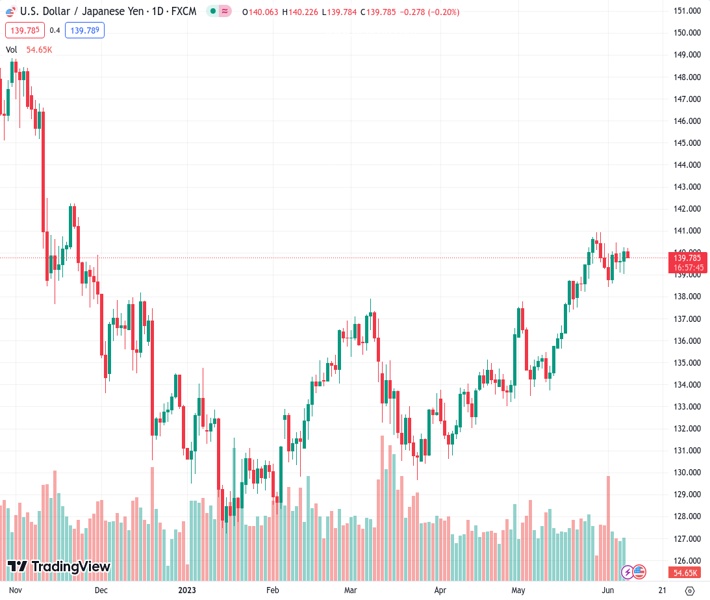
#USDJPY @ 139.795 edges lower on Thursday and reverses a part of the overnight positive move. (Pivot Orderbook analysis)
…
This is a premium post.
[s2If !current_user_can(access_s2member_level4)]Please register for FREE REGISTER to read full post below containing analysis. In case of any error or you think you are not able to read the full post below, please email us at support#nehcap.com [lwa][/s2If] [s2If current_user_can(access_s2member_level1)]
- USD/JPY edges lower on Thursday and reverses a part of the overnight positive move.
- The recent range-bound price action constitutes the formation of a bullish rectangle.
- A convincing break below 139.00 is needed to support prospects for additional losses.
The pair currently trades last at 139.795.
The previous day high was 140.25 while the previous day low was 139.02. The daily 38.2% Fib levels comes at 139.78, expected to provide support. Similarly, the daily 61.8% fib level is at 139.49, expected to provide support.
The USD/JPY pair struggles to capitalize on the overnight goodish rebound from the 139.00 mark, or the weekly low and meets with some supply during the Asian session on Thursday. Spot prices currently trade around the 139.85 area, down nearly 0.20% for the day, though any meaningful downside still seems elusive.
Speculations for more sizeable interventions by the Bank of Japan (BoJ) to support the domestic currency, along with the cautious market mood, benefit the safe-haven Japanese Yen (JPY). Apart from this, a modest US Dollar (USD) downtick exerts some downward pressure on the USD/JPY pair. That said, the uncertainty over the Federal Reserve’s (Fed) rate-hike path and elevated US Treasury bond yields should help limit the downside for the buck, which, in turn, should lend support to the major.
From a technical perspective, the USD/JPY pair has been oscillating in a range since the beginning of the current week, forming a rectangle on hourly charts. Against the backdrop of a rally from the mid-133.00s, or the May monthly swing low, this might still be categorized as a bullish consolidation phase. Moreover, spot prices, so far, manage to hold above the upward-sloping 100-period Simple Moving Average (SMA) on the 4-hour chart, which favours bulls and supports prospects for further gains.
Bullish traders, however, need to wait for acceptance above the 140.00 psychological mark and a sustained break through the 140.20-140.30 horizontal resistance before placing fresh bets. The USD/JPY pair might then accelerate the positive move towards challenging the YTD peak, around the 140.90 region, touched in May. Some follow-through buying beyond the 141.00 mark will be seen as a fresh trigger for bullish traders and set the stage for a further appreciating move for the pair.
On the flip side, the 100-period SMA, currently pegged just ahead of the 139.00 round figure, might continue to protect the immediate downside. A convincing break below the 139.00 mark might prompt some technical selling and drag the USD/JPY pair to the monthly low, around the 138.45-138.40 zone. The downward trajectory could get extended further towards the 138.00 mark before spot prices eventually drop to the 137.30 region, representing the very important 200-day SMA support.
Technical Levels: Supports and Resistances
USDJPY currently trading at 139.88 at the time of writing. Pair opened at 140.1 and is trading with a change of -0.16 % .
| Overview | Overview.1 | |
|---|---|---|
| 0 | Today last price | 139.88 |
| 1 | Today Daily Change | -0.22 |
| 2 | Today Daily Change % | -0.16 |
| 3 | Today daily open | 140.10 |
The pair remains strongly bullish on the daily timeframe. It trades above its 20 SMA @ 138.6, 50 SMA 135.8, 100 SMA @ 134.3 and 200 SMA @ 137.31.
| Trends | Trends.1 | |
|---|---|---|
| 0 | Daily SMA20 | 138.60 |
| 1 | Daily SMA50 | 135.80 |
| 2 | Daily SMA100 | 134.30 |
| 3 | Daily SMA200 | 137.31 |
The previous day high was 140.25 while the previous day low was 139.02. The daily 38.2% Fib levels comes at 139.78, expected to provide support. Similarly, the daily 61.8% fib level is at 139.49, expected to provide support.
Note the levels of interest below:
- Pivot support is noted at 139.34, 138.57, 138.12
- Pivot resistance is noted at 140.56, 141.01, 141.78
| Levels | Levels.1 |
|---|---|
| Previous Daily High | 140.25 |
| Previous Daily Low | 139.02 |
| Previous Weekly High | 140.93 |
| Previous Weekly Low | 138.43 |
| Previous Monthly High | 140.93 |
| Previous Monthly Low | 133.50 |
| Daily Fibonacci 38.2% | 139.78 |
| Daily Fibonacci 61.8% | 139.49 |
| Daily Pivot Point S1 | 139.34 |
| Daily Pivot Point S2 | 138.57 |
| Daily Pivot Point S3 | 138.12 |
| Daily Pivot Point R1 | 140.56 |
| Daily Pivot Point R2 | 141.01 |
| Daily Pivot Point R3 | 141.78 |
[/s2If]
Nehcap Expert Advisor
The NEHCAP MT4 EA is high quality professional trading system geared to generate returns without using GRID or martingales. Each trade has strict risk per trade parameter. The pairs under management include EURUSD, GBPUSD, AUDCAD, AUDNZD,GBPAUD, EURAUD, EURCAD, CHFJPY and many more.
The system is trading live: LIVE ACCOUNT TRACKING
You can run it free. Apply for a free trial and track our account. Buy the system or use profit share mechanism to generate returns on your MT4.
Join Our Telegram Group


