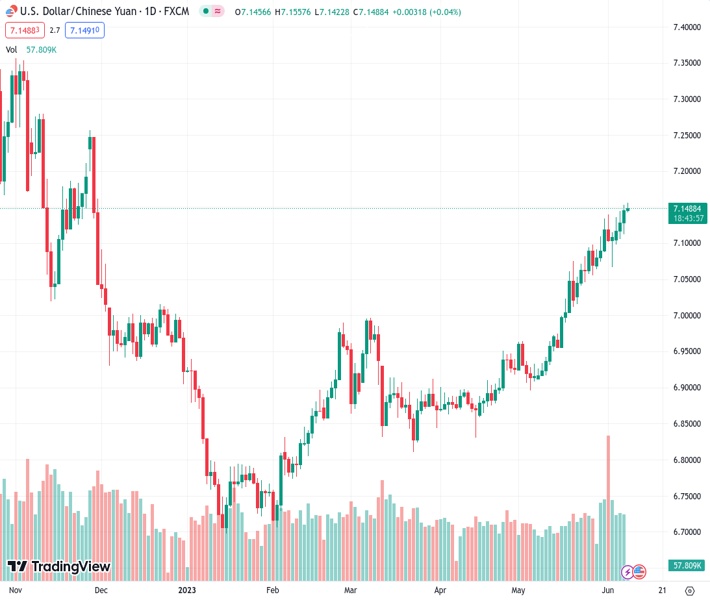
#USDCNH @ 7.14799 rises for the fifth consecutive day to prod late November 2022 high. (Pivot Orderbook analysis)
…
This is a premium post.
[s2If !current_user_can(access_s2member_level4)]Please register for FREE REGISTER to read full post below containing analysis. In case of any error or you think you are not able to read the full post below, please email us at support#nehcap.com [lwa][/s2If] [s2If current_user_can(access_s2member_level1)]
- USD/CNH rises for the fifth consecutive day to prod late November 2022 high.
- Multiple Chinese banks cut rates to fuel speculations of PBoC rate reduction.
- Market sentiment dwindles amid fresh fears of economic slowdown, higher rates.
- China inflation, second-tier US data can entertain traders ahead of the key next week.
The pair currently trades last at 7.14799.
The previous day high was 7.1534 while the previous day low was 7.1118. The daily 38.2% Fib levels comes at 7.1376, expected to provide support. Similarly, the daily 61.8% fib level is at 7.1277, expected to provide support.
USD/CNH remains on the front foot at the highest levels in six months, mildly bid near 7.1530 during early Thursday, as fears of the Federal Reserve’s (Fed) rate hikes contrast with the concerns that the People’s Bank of China will cut the benchmark rates. That said, the market’s fears of economic slowdown also weigh on the offshore Chinese Yuan (CNH).
That said, a slew of Chinese state banks including the Industrial and Commercial Bank of China, Bank of China and Construction Bank cut their benchmark rates. The same raises speculations that the Chinese central bank, namely the People’s Bank of China (PBOC), will also cut the rates.
Alternatively, China’s Director of China’s National Administration of Financial Regulation Li Yunze recently mentioned that the economy is still recovering.
On the other hand, the latest increase in the market’s bets on the Federal Reserve’s 25 bps rate hike in July increased, even as the June Federal Open Market Committee (FOMC) is likely to keep the rates unchanged, propel the USD/CNH price even as the US Dollar struggles of late.
Previously, the risk profile soured on the latest Organisation for Economic Co-operation and Development (OECD) report that said that the global economy is set for a weak recovery over the coming years as persistent core inflation and tighter monetary policy weigh on demand. The OECD report also mentioned, “Sees Chinese growth of 5.4% in 2023 and 5.1% in 2024 (previously 5.3% in 2023 and 4.9% in 2024).”
Against this backdrop, the US 10-year bond coupons remain mostly unchanged at 3.79% by the press time whereas the two-year yields grind higher to 4.54% as we write. While portraying the market’s mood, Wall Street closed mixed and S&500 Futures struggle for clear directions.
Looking forward, USD/CNH traders may need to keep their eyes on the risk catalysts for clear directions, which in turn highlights headlines surrounding growth and central banks. That said, Friday’s China inflation data will crucial to watch ahead of the next week’s all-important Federal Open Market Committee (FOMC) monetary policy meeting.
A one-month-old bullish trend channel, currently between 7.1830 and 7.1000, restricts short-term USD/CNH moves while keeping the bulls hopeful.
Technical Levels: Supports and Resistances
USDCNH currently trading at 7.1502 at the time of writing. Pair opened at 7.1474 and is trading with a change of 0.04% % .
| Overview | Overview.1 | |
|---|---|---|
| 0 | Today last price | 7.1502 |
| 1 | Today Daily Change | 0.0028 |
| 2 | Today Daily Change % | 0.04% |
| 3 | Today daily open | 7.1474 |
The pair remains strongly bullish on the daily timeframe. It trades above its 20 SMA @ 7.0611, 50 SMA 6.9661, 100 SMA @ 6.9111 and 200 SMA @ 6.9846.
| Trends | Trends.1 | |
|---|---|---|
| 0 | Daily SMA20 | 7.0611 |
| 1 | Daily SMA50 | 6.9661 |
| 2 | Daily SMA100 | 6.9111 |
| 3 | Daily SMA200 | 6.9846 |
The previous day high was 7.1534 while the previous day low was 7.1118. The daily 38.2% Fib levels comes at 7.1376, expected to provide support. Similarly, the daily 61.8% fib level is at 7.1277, expected to provide support.
Note the levels of interest below:
- Pivot support is noted at 7.1217, 7.096, 7.0801
- Pivot resistance is noted at 7.1633, 7.1792, 7.2049
| Levels | Levels.1 |
|---|---|
| Previous Daily High | 7.1534 |
| Previous Daily Low | 7.1118 |
| Previous Weekly High | 7.1400 |
| Previous Weekly Low | 7.0642 |
| Previous Monthly High | 7.1344 |
| Previous Monthly Low | 6.8962 |
| Daily Fibonacci 38.2% | 7.1376 |
| Daily Fibonacci 61.8% | 7.1277 |
| Daily Pivot Point S1 | 7.1217 |
| Daily Pivot Point S2 | 7.0960 |
| Daily Pivot Point S3 | 7.0801 |
| Daily Pivot Point R1 | 7.1633 |
| Daily Pivot Point R2 | 7.1792 |
| Daily Pivot Point R3 | 7.2049 |
[/s2If]
Nehcap Expert Advisor
The NEHCAP MT4 EA is high quality professional trading system geared to generate returns without using GRID or martingales. Each trade has strict risk per trade parameter. The pairs under management include EURUSD, GBPUSD, AUDCAD, AUDNZD,GBPAUD, EURAUD, EURCAD, CHFJPY and many more.
The system is trading live: LIVE ACCOUNT TRACKING
You can run it free. Apply for a free trial and track our account. Buy the system or use profit share mechanism to generate returns on your MT4.
Join Our Telegram Group


