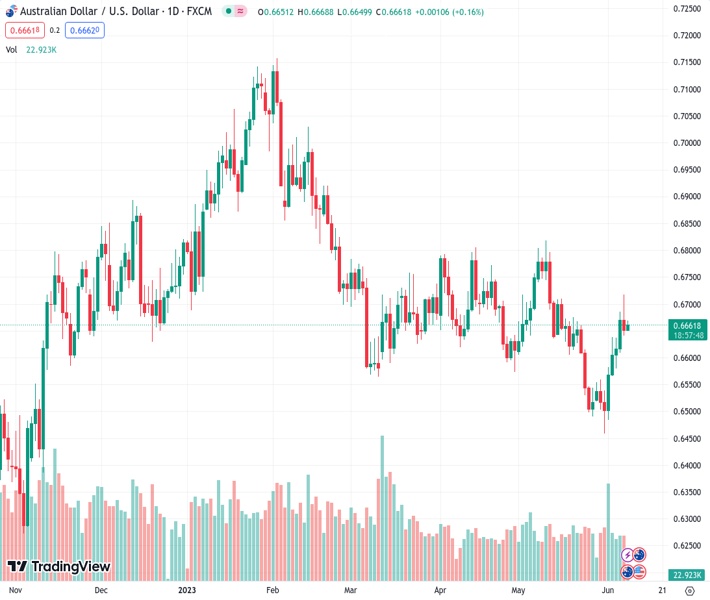
#AUDUSD @ 0.66620 picks up bids to reverse the previous day’s pullback from the highest level in a month. (Pivot Orderbook analysis)
…
This is a premium post.
[s2If !current_user_can(access_s2member_level4)]Please register for FREE REGISTER to read full post below containing analysis. In case of any error or you think you are not able to read the full post below, please email us at support#nehcap.com [lwa][/s2If] [s2If current_user_can(access_s2member_level1)]
- AUD/USD picks up bids to reverse the previous day’s pullback from the highest level in a month.
- Australia Trade Balance, Exports drop in April while Imports improve.
- Bond market’s consolidation after a heavy move, rate chatters in China also underpin Aussie pair’s rebound.
- Risk catalysts, mid-tier US data eyed for clear directions.
The pair currently trades last at 0.66620.
The previous day high was 0.6717 while the previous day low was 0.6642. The daily 38.2% Fib levels comes at 0.6671, expected to provide resistance. Similarly, the daily 61.8% fib level is at 0.6688, expected to provide resistance.
AUD/USD eases from intraday high to near 0.6660 while paring the late Wednesday’s rebound from 0.6640 during early Thursday morning. In doing so, the Aussie pair fades the early Asian session’s run-up to refresh the monthly top, after reversing from the highest levels since May 11 the previous day. With this, the Aussie pair justifies mixed Australia trade data for April amid sluggish markets.
Australia’s Trade Balance declines to 11,158M in April versus 14,000M market forecasts and 15,269M prior. That said, the Pacific nation’s Exports drop to -5.0%, versus 4.0% prior, whereas the Imports repeat 2.0% growth for the said month.
Apart from the mixed Aussie data, sluggish sentiment in the market also prods the AUD/USD pair, due to its risk-barometer status. The reason could be linked to the fears of a global economic slowdown and higher rates.
However, hawkish concerns from the Reserve Bank of Australia (RBA) contrast with rate cuts by Chinese banks to underpin the AUD/USD pair’s recovery.
Earlier in the day, a slew of Chinese banks including the Industrial and Commercial Bank of China, Bank of China and Construction Bank cut their benchmark rates. The same raises speculations that the Chinese central bank, namely the People’s Bank of China (PBOC), will also cut the rates, which in turn suggests more fund flow to the economy and is positive for the AUD/USD pair due to the Aussie-China trade ties.
Against this backdrop, the benchmark US 10-year Treasury bond yields rose the most in five weeks to 3.79% while the two-year counterpart marched to 4.52% at the latest. That said, the US 10-year bond coupons remain mostly unchanged at 3.79% by the press time whereas the two-year yields grind higher to 4.54% as we write. While portraying the market’s mood, Wall Street closed mixed and S&500 Futures struggle for clear directions.
Looking ahead, the US Initial Jobless Claims and the central bank chatters can entertain the AUD/USD pair traders ahead of Friday’s inflation data from China.
Unless providing a clear upside break of the 0.6715 resistance confluence, encompassing two downward-sloping resistance lines from February 02 and 14 respectively, the AUD/USD pair’s upside remains elusive.
Technical Levels: Supports and Resistances
AUDUSD currently trading at 0.6667 at the time of writing. Pair opened at 0.6652 and is trading with a change of 0.23% % .
| Overview | Overview.1 | |
|---|---|---|
| 0 | Today last price | 0.6667 |
| 1 | Today Daily Change | 0.0015 |
| 2 | Today Daily Change % | 0.23% |
| 3 | Today daily open | 0.6652 |
The pair is trading above its 20 Daily moving average @ 0.6607, above its 50 Daily moving average @ 0.6662 , below its 100 Daily moving average @ 0.6745 and below its 200 Daily moving average @ 0.6692
| Trends | Trends.1 | |
|---|---|---|
| 0 | Daily SMA20 | 0.6607 |
| 1 | Daily SMA50 | 0.6662 |
| 2 | Daily SMA100 | 0.6745 |
| 3 | Daily SMA200 | 0.6692 |
The previous day high was 0.6717 while the previous day low was 0.6642. The daily 38.2% Fib levels comes at 0.6671, expected to provide resistance. Similarly, the daily 61.8% fib level is at 0.6688, expected to provide resistance.
Note the levels of interest below:
- Pivot support is noted at 0.6623, 0.6595, 0.6548
- Pivot resistance is noted at 0.6699, 0.6746, 0.6775
| Levels | Levels.1 |
|---|---|
| Previous Daily High | 0.6717 |
| Previous Daily Low | 0.6642 |
| Previous Weekly High | 0.6639 |
| Previous Weekly Low | 0.6458 |
| Previous Monthly High | 0.6818 |
| Previous Monthly Low | 0.6458 |
| Daily Fibonacci 38.2% | 0.6671 |
| Daily Fibonacci 61.8% | 0.6688 |
| Daily Pivot Point S1 | 0.6623 |
| Daily Pivot Point S2 | 0.6595 |
| Daily Pivot Point S3 | 0.6548 |
| Daily Pivot Point R1 | 0.6699 |
| Daily Pivot Point R2 | 0.6746 |
| Daily Pivot Point R3 | 0.6775 |
[/s2If]
Nehcap Expert Advisor
The NEHCAP MT4 EA is high quality professional trading system geared to generate returns without using GRID or martingales. Each trade has strict risk per trade parameter. The pairs under management include EURUSD, GBPUSD, AUDCAD, AUDNZD,GBPAUD, EURAUD, EURCAD, CHFJPY and many more.
The system is trading live: LIVE ACCOUNT TRACKING
You can run it free. Apply for a free trial and track our account. Buy the system or use profit share mechanism to generate returns on your MT4.
Join Our Telegram Group


