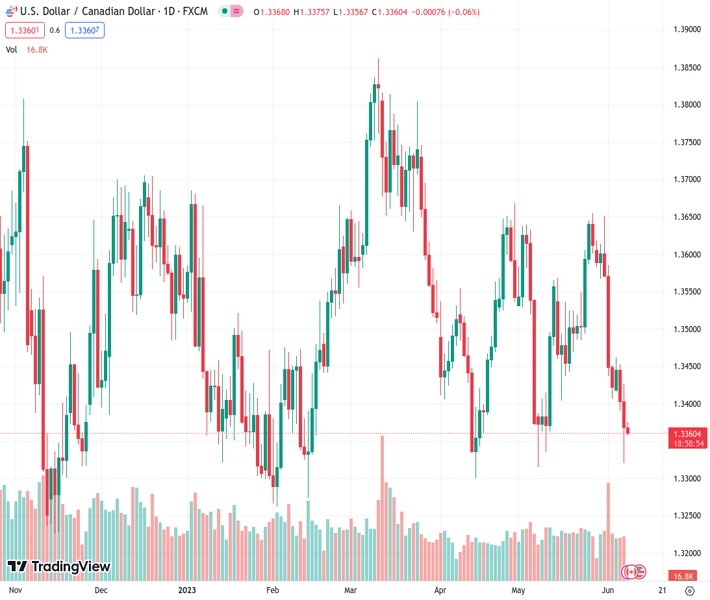
#USDCAD @ 1.33609 trades with a mild negative bias for the third successive day on Thursday. (Pivot Orderbook analysis)
…
This is a premium post.
[s2If !current_user_can(access_s2member_level4)]Please register for FREE REGISTER to read full post below containing analysis. In case of any error or you think you are not able to read the full post below, please email us at support#nehcap.com [lwa][/s2If] [s2If current_user_can(access_s2member_level1)]
- USD/CAD trades with a mild negative bias for the third successive day on Thursday.
- The BoC’s surprise rate hike continues to underpin the CAD and weighs on the pair.
- The Fed rate-hike uncertainty might hold back bears from placing aggressive bets.
The pair currently trades last at 1.33609.
The previous day high was 1.3427 while the previous day low was 1.3321. The daily 38.2% Fib levels comes at 1.3361, expected to provide resistance. Similarly, the daily 61.8% fib level is at 1.3386, expected to provide resistance.
The USD/CAD pair struggles to capitalize on the overnight late rebound from the 1.3320 area, or a one-month low and meets with a fresh supply during the Asian session on Thursday. The pair trades with a mild negative bias for the third successive day and is currently placed just above the mid-1.3300s.
The Canadian Dollar (CAD) continues to draw support from the Bank of Canada’s (BoC) surprise 25 bps lift-off on Wednesday, which, along with subdued US Dollar (USD) price action, exert some downward pressure on the USD/CAD pair. It is worth recalling that the Canadian central bank defied market expectations by restarting its policy tightening campaign and hiked its overnight rate to 4.75%, or a 22-year high. In the accompanying policy statement, the BoC noted that concerns have increased that CPI could get stuck materially above the 2% target. The markets were quick to price in yet another increase next month to ratchet down an overheating economy and stubbornly high inflation.
The USD, on the other hand, remains confined in a familiar trading band held over the past two weeks or so as investors seem uncertain over the Federal Reserve’s (Fed) rate-hike path. Dovish rhetoric by several Fed officials last week fueled speculations for an imminent pause in the US central bank’s policy tightening cycle. In fact, the current market pricing indicates a greater chance that the Fed will keep rates unchanged at its June 13-14 policy meeting. That said, the recent inflation and labor market data from the US kept alive hopes for a 25 bps lift-off next week.
Moreover, an unexpected rate hike by other major central banks this week, including the Reserve Bank of Australia and the BoC, suggests that the fight against inflation is not over yet. This, in turn, supports the view that the Fed will likely keep interest rates higher for longer and continues to act as a tailwind for elevated US Treasury bond yields, which is seen lending some support to the buck and the USD/CAD pair Hence, it will be prudent to wait for some follow-through selling before traders start positioning for an extension of an over a one-week-old downtrend.
Market participants now look forward to the release of the Weekly Initial Jobless Claims data from the US, due later during the North American session. Apart from this, the US bond yields and the broader risk sentiment will drive demand for the safe-haven USD. Traders will further take cues from Oil price dynamics, which tend to influence the commodity-linked Loonie, for a fresh impetus and grab short-term trading opportunities around the USD/CAD pair.
Technical Levels: Supports and Resistances
USDCAD currently trading at 1.3364 at the time of writing. Pair opened at 1.3369 and is trading with a change of -0.04 % .
| Overview | Overview.1 | |
|---|---|---|
| 0 | Today last price | 1.3364 |
| 1 | Today Daily Change | -0.0005 |
| 2 | Today Daily Change % | -0.0400 |
| 3 | Today daily open | 1.3369 |
The pair remains strongly bearish on the daily time frame. It trades below the 20 SMA @ 1.3509, 50 SMA 1.3495, 100 SMA @ 1.3517 and 200 SMA @ 1.3512.
| Trends | Trends.1 | |
|---|---|---|
| 0 | Daily SMA20 | 1.3509 |
| 1 | Daily SMA50 | 1.3495 |
| 2 | Daily SMA100 | 1.3517 |
| 3 | Daily SMA200 | 1.3512 |
The previous day high was 1.3427 while the previous day low was 1.3321. The daily 38.2% Fib levels comes at 1.3361, expected to provide resistance. Similarly, the daily 61.8% fib level is at 1.3386, expected to provide resistance.
Note the levels of interest below:
- Pivot support is noted at 1.3318, 1.3266, 1.3212
- Pivot resistance is noted at 1.3424, 1.3478, 1.3529
| Levels | Levels.1 |
|---|---|
| Previous Daily High | 1.3427 |
| Previous Daily Low | 1.3321 |
| Previous Weekly High | 1.3651 |
| Previous Weekly Low | 1.3407 |
| Previous Monthly High | 1.3655 |
| Previous Monthly Low | 1.3315 |
| Daily Fibonacci 38.2% | 1.3361 |
| Daily Fibonacci 61.8% | 1.3386 |
| Daily Pivot Point S1 | 1.3318 |
| Daily Pivot Point S2 | 1.3266 |
| Daily Pivot Point S3 | 1.3212 |
| Daily Pivot Point R1 | 1.3424 |
| Daily Pivot Point R2 | 1.3478 |
| Daily Pivot Point R3 | 1.3529 |
[/s2If]
Nehcap Expert Advisor
The NEHCAP MT4 EA is high quality professional trading system geared to generate returns without using GRID or martingales. Each trade has strict risk per trade parameter. The pairs under management include EURUSD, GBPUSD, AUDCAD, AUDNZD,GBPAUD, EURAUD, EURCAD, CHFJPY and many more.
The system is trading live: LIVE ACCOUNT TRACKING
You can run it free. Apply for a free trial and track our account. Buy the system or use profit share mechanism to generate returns on your MT4.
Join Our Telegram Group


