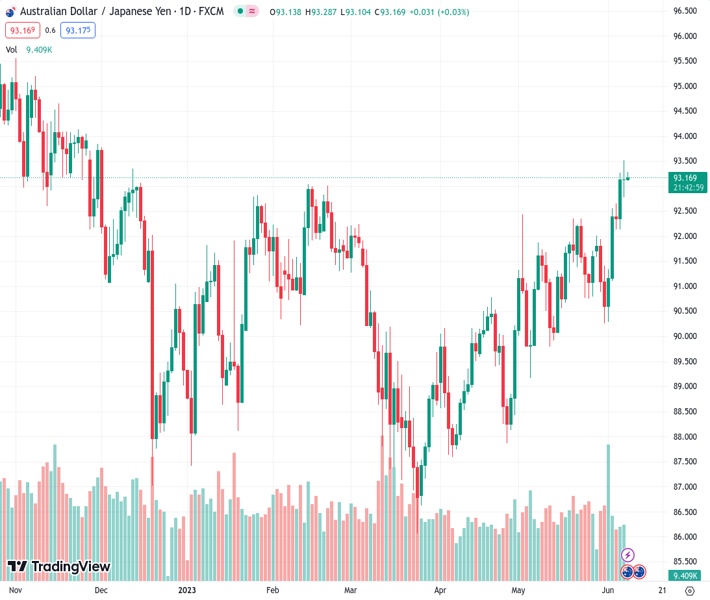
#AUDJPY @ 93.1690 forms a doji at YTD highs, signaling a possible pause in the rally. (Pivot Orderbook analysis)
…
This is a premium post.
[s2If !current_user_can(access_s2member_level4)]Please register for FREE REGISTER to read full post below containing analysis. In case of any error or you think you are not able to read the full post below, please email us at support#nehcap.com [lwa][/s2If] [s2If current_user_can(access_s2member_level1)]
- AUD/JPY forms a doji at YTD highs, signaling a possible pause in the rally.
- Potential retracement could test the 91.89 support zone, an intersection of the 50% Fibonacci and Tenkan-Sen line.
- On the upside, surpassing the YTD high could push the pair towards 94.00, with a potential target at 95.00.
The pair currently trades last at 93.1690.
The previous day high was 93.26 while the previous day low was 92.14. The daily 38.2% Fib levels comes at 92.83, expected to provide support. Similarly, the daily 61.8% fib level is at 92.57, expected to provide support.
AUD/JPY hovers at around the 93.20 area as the Asian session begins, following Wednesday’s session, which formed a doji after reaching new year-to-date (YTD) highs. However, a daily close below the June 6 high of 93.26 suggests buyers are losing control ahead of Thursday’s session.
AUD/JPY seems to pause its rally, as a doji emerged on Wednesday after hitting a new YTD high. However, in the medium term, the AUD/JPY is still upward biased but might pull back toward the confluence of the 50% Fibonacci retracement and the Tenkan-Sen line at around 91.89. Further downside is expected, towards the next confluence, of the Kijun-Sen line and the 61.8% Fibo retracement at around 91.34/50, before resuming its uptrend.
Conversely, a bullish continuation will witness the AUD/JPY exploding past the YTD high and testing the psychological level at 94.00. A breach of the latter will expose the November 16 daily high at 94.65, ahead of gaining traction and challenging the 95.00 figure.
Technical Levels: Supports and Resistances
AUDJPY currently trading at 93.19 at the time of writing. Pair opened at 93.16 and is trading with a change of 0.03 % .
| Overview | Overview.1 | |
|---|---|---|
| 0 | Today last price | 93.19 |
| 1 | Today Daily Change | 0.03 |
| 2 | Today Daily Change % | 0.03 |
| 3 | Today daily open | 93.16 |
The pair remains strongly bullish on the daily timeframe. It trades above its 20 SMA @ 91.46, 50 SMA 90.36, 100 SMA @ 90.52 and 200 SMA @ 91.81.
| Trends | Trends.1 | |
|---|---|---|
| 0 | Daily SMA20 | 91.46 |
| 1 | Daily SMA50 | 90.36 |
| 2 | Daily SMA100 | 90.52 |
| 3 | Daily SMA200 | 91.81 |
The previous day high was 93.26 while the previous day low was 92.14. The daily 38.2% Fib levels comes at 92.83, expected to provide support. Similarly, the daily 61.8% fib level is at 92.57, expected to provide support.
Note the levels of interest below:
- Pivot support is noted at 92.44, 91.73, 91.32
- Pivot resistance is noted at 93.57, 93.98, 94.69
| Levels | Levels.1 |
|---|---|
| Previous Daily High | 93.26 |
| Previous Daily Low | 92.14 |
| Previous Weekly High | 92.56 |
| Previous Weekly Low | 90.26 |
| Previous Monthly High | 92.44 |
| Previous Monthly Low | 89.16 |
| Daily Fibonacci 38.2% | 92.83 |
| Daily Fibonacci 61.8% | 92.57 |
| Daily Pivot Point S1 | 92.44 |
| Daily Pivot Point S2 | 91.73 |
| Daily Pivot Point S3 | 91.32 |
| Daily Pivot Point R1 | 93.57 |
| Daily Pivot Point R2 | 93.98 |
| Daily Pivot Point R3 | 94.69 |
[/s2If]
Nehcap Expert Advisor
The NEHCAP MT4 EA is high quality professional trading system geared to generate returns without using GRID or martingales. Each trade has strict risk per trade parameter. The pairs under management include EURUSD, GBPUSD, AUDCAD, AUDNZD,GBPAUD, EURAUD, EURCAD, CHFJPY and many more.
The system is trading live: LIVE ACCOUNT TRACKING
You can run it free. Apply for a free trial and track our account. Buy the system or use profit share mechanism to generate returns on your MT4.
Join Our Telegram Group


