#NZDUSD @ 0.60355 stays pressured at the lowest levels in a week., @nehcap view: Limited downside expected (Pivot Orderbook analysis)
…
This is a premium post.
[s2If !current_user_can(access_s2member_level4)]Please register for FREE REGISTER to read full post below containing analysis. In case of any error or you think you are not able to read the full post below, please email us at support#nehcap.com [lwa][/s2If] [s2If current_user_can(access_s2member_level1)]
- NZD/USD stays pressured at the lowest levels in a week.
- NZ Q1 Manufacturing Sales improved from prior but slide beneath upbeat forecasts.
- Clear downside break of one-week-old symmetrical triangle, bearish MACD signals suggest further fall in Kiwi price.
- RSI conditions suggest bottom-picking around yearly low marked in the last week.
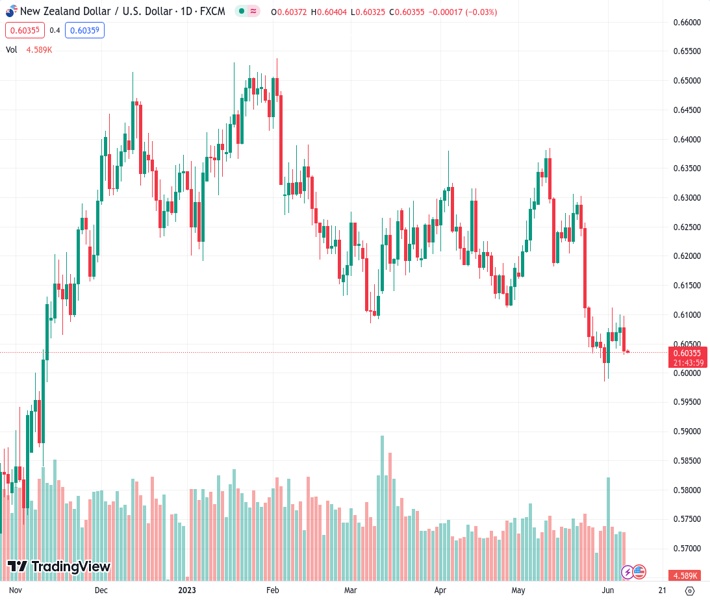
The pair currently trades last at 0.60355.
The previous day high was 0.61 while the previous day low was 0.6045. The daily 38.2% Fib levels comes at 0.6079, expected to provide resistance. Similarly, the daily 61.8% fib level is at 0.6066, expected to provide resistance.
NZD/USD bears occupy the driver’s seat as the Kiwi pair remains depressed at the weekly low surrounding 0.6030 amid early Asian session on Thursday, after falling the most in a fortnight the previous day.
In doing so, the Kiwi pair ignores the recently firmer New Zealand (NZ) data while paying more attention to the previous day’s downside break of a one-weeklong symmetrical triangle. That said, NZ Manufacturing Sales improves to -2.1% in the first quarter (Q1) of 2023 versus 3.9% expected and -4.7% prior.
It should be noted that the heaviest bearish MACD signals in nearly two weeks join the aforementioned triangle breakdown to keep the NZD/USD bears hopeful.
With this, the quote appears all set to prod the 0.6000 psychological magnet. However, the RSI (14) is below the 50.0 level and hence the yearly low marked in the last week around 0.5985 may offer opportunity to the counter-trend traders to take the risk.
Should the quote fails to recover from 0.5985, the odds of witnessing a slump towards the early October 2022 top near 0.5815 can’t be ruled out.
On the contrary, NZD/USD recovery appears elusive unless the quote stays below the previously stated triangle formation’s bottom line, close to 0.6065 at the latest. Even so, the top of the triangle, near 0.6100, can act as an extra check for the bulls before giving them control.
Following that, a convergence of the 200-SMA and 50% Fibonacci retracement level of the pair’s May 10-31 downturn, around 0.6180, will be the key to watch for the NZD/USD bulls.
Trend: Limited downside expected
Technical Levels: Supports and Resistances
NZDUSD currently trading at 0.6036 at the time of writing. Pair opened at 0.6078 and is trading with a change of -0.69% % .
| Overview | Overview.1 | |
|---|---|---|
| 0 | Today last price | 0.6036 |
| 1 | Today Daily Change | -0.0042 |
| 2 | Today Daily Change % | -0.69% |
| 3 | Today daily open | 0.6078 |
The pair remains strongly bearish on the daily time frame. It trades below the 20 SMA @ 0.6154, 50 SMA 0.6198, 100 SMA @ 0.6244 and 200 SMA @ 0.6149.
| Trends | Trends.1 | |
|---|---|---|
| 0 | Daily SMA20 | 0.6154 |
| 1 | Daily SMA50 | 0.6198 |
| 2 | Daily SMA100 | 0.6244 |
| 3 | Daily SMA200 | 0.6149 |
The previous day high was 0.61 while the previous day low was 0.6045. The daily 38.2% Fib levels comes at 0.6079, expected to provide resistance. Similarly, the daily 61.8% fib level is at 0.6066, expected to provide resistance.
Note the levels of interest below:
- Pivot support is noted at 0.6049, 0.6019, 0.5993
- Pivot resistance is noted at 0.6104, 0.613, 0.616
| Levels | Levels.1 |
|---|---|
| Previous Daily High | 0.6100 |
| Previous Daily Low | 0.6045 |
| Previous Weekly High | 0.6112 |
| Previous Weekly Low | 0.5985 |
| Previous Monthly High | 0.6385 |
| Previous Monthly Low | 0.5985 |
| Daily Fibonacci 38.2% | 0.6079 |
| Daily Fibonacci 61.8% | 0.6066 |
| Daily Pivot Point S1 | 0.6049 |
| Daily Pivot Point S2 | 0.6019 |
| Daily Pivot Point S3 | 0.5993 |
| Daily Pivot Point R1 | 0.6104 |
| Daily Pivot Point R2 | 0.6130 |
| Daily Pivot Point R3 | 0.6160 |
[/s2If]
Nehcap Expert Advisor
The NEHCAP MT4 EA is high quality professional trading system geared to generate returns without using GRID or martingales. Each trade has strict risk per trade parameter. The pairs under management include EURUSD, GBPUSD, AUDCAD, AUDNZD,GBPAUD, EURAUD, EURCAD, CHFJPY and many more.
The system is trading live: LIVE ACCOUNT TRACKING
You can run it free. Apply for a free trial and track our account. Buy the system or use profit share mechanism to generate returns on your MT4.
Join Our Telegram Group


