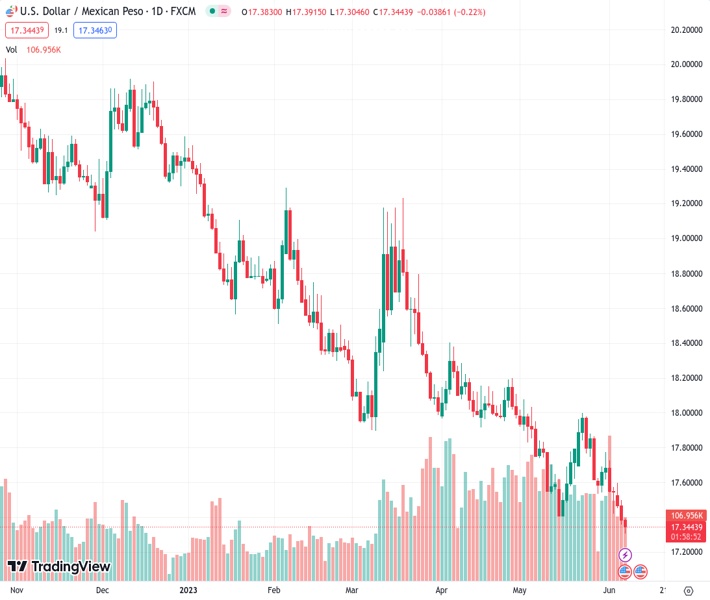
#USDMXN @ 17.3506 sinks to a seven-year low, influenced by the MXN’s favorable interest rate and Fed’s dovish stance. (Pivot Orderbook analysis)
…
This is a premium post.
[s2If !current_user_can(access_s2member_level4)]Please register for FREE REGISTER to read full post below containing analysis. In case of any error or you think you are not able to read the full post below, please email us at support#nehcap.com [lwa][/s2If] [s2If current_user_can(access_s2member_level1)]
- USD/MXN sinks to a seven-year low, influenced by the MXN’s favorable interest rate and Fed’s dovish stance.
- Despite USD/MXN decline, higher US Treasury bond yields hint at a potential Fed rate hike in July.
- A widened US trade deficit for April, driven by falling exports and rising imports, contributes to USD’s depreciation against the MXN.
The pair currently trades last at 17.3506.
The previous day high was 17.4978 while the previous day low was 17.3714. The daily 38.2% Fib levels comes at 17.4197, expected to provide resistance. Similarly, the daily 61.8% fib level is at 17.4495, expected to provide resistance.
USD/MXN collapsed to new seven-year lows on Wednesday, as the interest rate differential favors the Mexican Peso (MXN), while the US Dollar (USD) weakened on last week’s Fed dovish commentary ahead of the next week’s monetary policy meeting. Even though a risk-off impulse is present in the markets, the USD/MXN is trading at around 17.3600s after hitting a daily high of 17.3915.
Sentiment remains deteriorated, as shown by US equities. Higher US Treasury bond yields cushion the USD/MXN from falling further, as investors bet the US Federal Reserve would hike rates in July after skipping the June meeting. The CME FedWatch Tool portrays odds for a 25-bps increase at 50.8%, at around the same level as yesterday.
Nevertheless, G10 central banks tightening monetary policy after skipping some rate-setting decisions keeps investors nervous about the Fed’s next move. During the last week, policymakers stressed that a pause is necessary to assess the impact of the cumulative tightening in the economy.
Data-wise, the US economic agenda featured the US Trade Balance, showing the deficit broadened in April, compared with March’s data. Numbers came at $-74.6B in April of 2023, vs. March’s $-60.B. A notable dip in exports contributed to this shift, while imports rose sharply
The greenback shifted positively; printing gains as shown by the US Dollar Index (DXY). The DXY, which tracks the USD performance against a basket of six currencies, pares its earlier losses, up 0.04%, at 104.078.
After testing the 17.99 on May 26, the USD/MXN plunged 3.50%, sponsored by overall MXN strength. Swing In market sentiment tempered the pair’s fall, but even comments that the Bank of Mexico would keep rates unchanged for two meetings was no excuse for the MXN to appreciate. Technical indicators like the Relative Strength Index (RSI) and the three-day Rate of Change (RoC) suggest that sellers remain in charge. That said, the USD/MXN next support would be the year-to-date (YTD) low of 17.3046. A breach of the latter will expose the 2016 low of 17.0500 before diving to 17.0000. Conversely, the USD/MXN first resistance would be the 20-day EMA at 17.6314, followed by the 50-day EMA at 17.8587.
Technical Levels: Supports and Resistances
USDMXN currently trading at 17.3584 at the time of writing. Pair opened at 17.3843 and is trading with a change of -0.15 % .
| Overview | Overview.1 | |
|---|---|---|
| 0 | Today last price | 17.3584 |
| 1 | Today Daily Change | -0.0259 |
| 2 | Today Daily Change % | -0.1500 |
| 3 | Today daily open | 17.3843 |
The pair remains strongly bearish on the daily time frame. It trades below the 20 SMA @ 17.6412, 50 SMA 17.8762, 100 SMA @ 18.229 and 200 SMA @ 18.9589.
| Trends | Trends.1 | |
|---|---|---|
| 0 | Daily SMA20 | 17.6412 |
| 1 | Daily SMA50 | 17.8762 |
| 2 | Daily SMA100 | 18.2290 |
| 3 | Daily SMA200 | 18.9589 |
The previous day high was 17.4978 while the previous day low was 17.3714. The daily 38.2% Fib levels comes at 17.4197, expected to provide resistance. Similarly, the daily 61.8% fib level is at 17.4495, expected to provide resistance.
Note the levels of interest below:
- Pivot support is noted at 17.3378, 17.2914, 17.2114
- Pivot resistance is noted at 17.4643, 17.5443, 17.5907
| Levels | Levels.1 |
|---|---|
| Previous Daily High | 17.4978 |
| Previous Daily Low | 17.3714 |
| Previous Weekly High | 17.7716 |
| Previous Weekly Low | 17.4195 |
| Previous Monthly High | 18.0780 |
| Previous Monthly Low | 17.4203 |
| Daily Fibonacci 38.2% | 17.4197 |
| Daily Fibonacci 61.8% | 17.4495 |
| Daily Pivot Point S1 | 17.3378 |
| Daily Pivot Point S2 | 17.2914 |
| Daily Pivot Point S3 | 17.2114 |
| Daily Pivot Point R1 | 17.4643 |
| Daily Pivot Point R2 | 17.5443 |
| Daily Pivot Point R3 | 17.5907 |
[/s2If]
Nehcap Expert Advisor
The NEHCAP MT4 EA is high quality professional trading system geared to generate returns without using GRID or martingales. Each trade has strict risk per trade parameter. The pairs under management include EURUSD, GBPUSD, AUDCAD, AUDNZD,GBPAUD, EURAUD, EURCAD, CHFJPY and many more.
The system is trading live: LIVE ACCOUNT TRACKING
You can run it free. Apply for a free trial and track our account. Buy the system or use profit share mechanism to generate returns on your MT4.
Join Our Telegram Group


