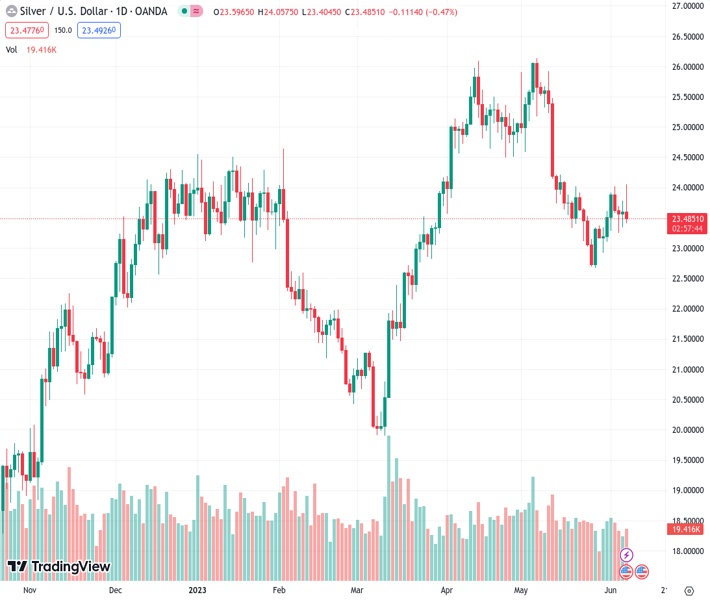
#XAGUSD @ 23.482 Silver prices dropped after testing weekly highs of $24.00, impacted by rising US bond yields. (Pivot Orderbook analysis)
…
This is a premium post.
[s2If !current_user_can(access_s2member_level4)]Please register for FREE REGISTER to read full post below containing analysis. In case of any error or you think you are not able to read the full post below, please email us at support#nehcap.com [lwa][/s2If] [s2If current_user_can(access_s2member_level1)]
- Silver prices dropped after testing weekly highs of $24.00, impacted by rising US bond yields.
- Bullish momentum was curbed by the strong US Dollar and significant resistance at the $24.00 area, according to technical indicators.
- Downward bias confirmed by bearish Relative Strength Index (RSI) and three-day Rate of Change (RoC).
The pair currently trades last at 23.482.
The previous day high was 23.78 while the previous day low was 23.34. The daily 38.2% Fib levels comes at 23.61, expected to provide resistance. Similarly, the daily 61.8% fib level is at 23.51, expected to provide resistance.
Silver price dropped after testing weekly highs of $24.00, and retraces weighed due to elevated US bond yields, strong US Dollar (USD), and technical indicators. The XAG/USD exchanges hands at around $23.40s after hitting a weekly high of $24.05.
XAG/USD remains neutral-to-downward biased, unable to break decisively above the $24.00 mark area. Technical indicators, like the 50- and 20-day Exponential Moving Averages (EMAs) confluence at $23.71-$23.87, dragged Silver’s spot price lower.
Furthermore, the Relative Strength Index (RSI) indicator and the three-day Rate of Change (RoC) portray that sellers are in charge, both at bearish territory warrant downward action.
Therefore, the XAG/USD first support would be the current week’s low at $23.25, which, once cleared, the white metal could extend its losses toward the $23.00 figure. If XAG/USD slides further will challenge the 200-day EMA at $22.87.
Otherwise, the XAG/USD resistance area would be the abovementioned confluence of the 20/50-day EMAs, at around $23.71-$23.87, which, once breached, could spark a test of $24.00. if XAG/USD clears that area, the next supply zone would be the $25.00 mark.
Technical Levels: Supports and Resistances
XAGUSD currently trading at 23.44 at the time of writing. Pair opened at 23.6 and is trading with a change of -0.68 % .
| Overview | Overview.1 | |
|---|---|---|
| 0 | Today last price | 23.44 |
| 1 | Today Daily Change | -0.16 |
| 2 | Today Daily Change % | -0.68 |
| 3 | Today daily open | 23.60 |
The pair is trading below its 20 Daily moving average @ 23.66, below its 50 Daily moving average @ 24.47 , above its 100 Daily moving average @ 23.34 and above its 200 Daily moving average @ 22.17
| Trends | Trends.1 | |
|---|---|---|
| 0 | Daily SMA20 | 23.66 |
| 1 | Daily SMA50 | 24.47 |
| 2 | Daily SMA100 | 23.34 |
| 3 | Daily SMA200 | 22.17 |
The previous day high was 23.78 while the previous day low was 23.34. The daily 38.2% Fib levels comes at 23.61, expected to provide resistance. Similarly, the daily 61.8% fib level is at 23.51, expected to provide resistance.
Note the levels of interest below:
- Pivot support is noted at 23.36, 23.13, 22.93
- Pivot resistance is noted at 23.8, 24.01, 24.24
| Levels | Levels.1 |
|---|---|
| Previous Daily High | 23.78 |
| Previous Daily Low | 23.34 |
| Previous Weekly High | 24.02 |
| Previous Weekly Low | 22.93 |
| Previous Monthly High | 26.14 |
| Previous Monthly Low | 22.68 |
| Daily Fibonacci 38.2% | 23.61 |
| Daily Fibonacci 61.8% | 23.51 |
| Daily Pivot Point S1 | 23.36 |
| Daily Pivot Point S2 | 23.13 |
| Daily Pivot Point S3 | 22.93 |
| Daily Pivot Point R1 | 23.80 |
| Daily Pivot Point R2 | 24.01 |
| Daily Pivot Point R3 | 24.24 |
[/s2If]
Nehcap Expert Advisor
The NEHCAP MT4 EA is high quality professional trading system geared to generate returns without using GRID or martingales. Each trade has strict risk per trade parameter. The pairs under management include EURUSD, GBPUSD, AUDCAD, AUDNZD,GBPAUD, EURAUD, EURCAD, CHFJPY and many more.
The system is trading live: LIVE ACCOUNT TRACKING
You can run it free. Apply for a free trial and track our account. Buy the system or use profit share mechanism to generate returns on your MT4.
Join Our Telegram Group


