#USDJPY @ 140.196 rose past the 140.00 zone during the New York session. (Pivot Orderbook analysis)
…
This is a premium post.
[s2If !current_user_can(access_s2member_level4)]Please register for FREE REGISTER to read full post below containing analysis. In case of any error or you think you are not able to read the full post below, please email us at support#nehcap.com [lwa][/s2If] [s2If current_user_can(access_s2member_level1)]
- USD/JPY rose past the 140.00 zone during the New York session.
- The US Dollar cleared daily losses amid rising US bond yields and a cautious market mood.
- Investors await Q1 Gross Domestic Product data from Japan.
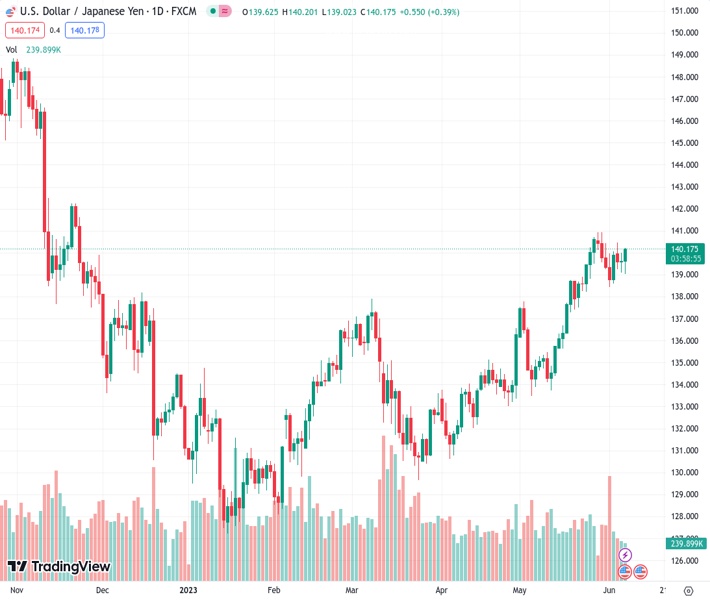
The pair currently trades last at 140.196.
The previous day high was 140.0 while the previous day low was 139.1. The daily 38.2% Fib levels comes at 139.65, expected to provide support. Similarly, the daily 61.8% fib level is at 139.44, expected to provide support.
The USD/JPY pair rose for a second consecutive day on Wednesday to currently trade around 140.00. On the other hand, as per the DXY index, the USD weakened against most of its rivals earlier but cleared daily losses finding support at 103.66 and recovering above 104.00 on the back of significant increases in the US bond yields. Another surprising rate hike, this time by the Bank of Canada (BoC), increased slightly the hawkish bets on the Fed.
Market expectations for the upcoming June 13-14 Federal Reserve (Fed) still favour a no-hike despite the BoC surprise hike on Wednesday boosted prospects of another Fed hike. According to the CME FedWatch Tool, investors are betting on higher odds (64.7%) of the Fed not raising interest rates with expectations of maintaining the target rate at 5.25% but the probabilities of a 25 bps hike jumped to 30%
Against this backdrop, the US bond yields are seeing increases across the curve. The 10-year bond yield rose to 3.78%, while the 2-year yield stands at 4.59% and the 5-year yielding 3.94%, all up on the day, lifting the US Dollar.
On the other hand, the Yen’s decline might be limited by speculations of Japanese authorities intervening in the markets to support the domestic currency. For Wednesday’s session, a cautious market mood amid weak Chinese economic data reported during the Asia session weighed on the JPY as it fueled a risk-off market mood.
According to the daily chart, the USD/JPY holds a neutral to bullish outlook for the short term. The Relative Strength Index (RSI) holds resilient above its midline while the Moving Average Convergence Divergence (MACD) fell slightly to the negative zone, but the pair trading above the 20-,100- and 200-day Simple Moving Averages (SMAs) suggests that the overall technical outlook is positive for the pair.
If USD/JPY manages to move higher, the next resistance to watch is at the 140.00 level, followed by the 140.50 zone and the psychological mark at 141.00. On the other hand, the 139.50 zone level is key for USD/JPY to maintain its upside bias. If breached, the pair could see a steeper decline towards the 139.00 psychological level and weekly low and then at the 20-day Simple Moving Average (SMA) at 138.60.
Technical Levels: Supports and Resistances
USDJPY currently trading at 140.13 at the time of writing. Pair opened at 139.64 and is trading with a change of 0.35 % .
| Overview | Overview.1 | |
|---|---|---|
| 0 | Today last price | 140.13 |
| 1 | Today Daily Change | 0.49 |
| 2 | Today Daily Change % | 0.35 |
| 3 | Today daily open | 139.64 |
The pair remains strongly bullish on the daily timeframe. It trades above its 20 SMA @ 138.31, 50 SMA 135.65, 100 SMA @ 134.18 and 200 SMA @ 137.3.
| Trends | Trends.1 | |
|---|---|---|
| 0 | Daily SMA20 | 138.31 |
| 1 | Daily SMA50 | 135.65 |
| 2 | Daily SMA100 | 134.18 |
| 3 | Daily SMA200 | 137.30 |
The previous day high was 140.0 while the previous day low was 139.1. The daily 38.2% Fib levels comes at 139.65, expected to provide support. Similarly, the daily 61.8% fib level is at 139.44, expected to provide support.
Note the levels of interest below:
- Pivot support is noted at 139.16, 138.68, 138.26
- Pivot resistance is noted at 140.06, 140.48, 140.96
| Levels | Levels.1 |
|---|---|
| Previous Daily High | 140.00 |
| Previous Daily Low | 139.10 |
| Previous Weekly High | 140.93 |
| Previous Weekly Low | 138.43 |
| Previous Monthly High | 140.93 |
| Previous Monthly Low | 133.50 |
| Daily Fibonacci 38.2% | 139.65 |
| Daily Fibonacci 61.8% | 139.44 |
| Daily Pivot Point S1 | 139.16 |
| Daily Pivot Point S2 | 138.68 |
| Daily Pivot Point S3 | 138.26 |
| Daily Pivot Point R1 | 140.06 |
| Daily Pivot Point R2 | 140.48 |
| Daily Pivot Point R3 | 140.96 |
[/s2If]
Nehcap Expert Advisor
The NEHCAP MT4 EA is high quality professional trading system geared to generate returns without using GRID or martingales. Each trade has strict risk per trade parameter. The pairs under management include EURUSD, GBPUSD, AUDCAD, AUDNZD,GBPAUD, EURAUD, EURCAD, CHFJPY and many more.
The system is trading live: LIVE ACCOUNT TRACKING
You can run it free. Apply for a free trial and track our account. Buy the system or use profit share mechanism to generate returns on your MT4.
Join Our Telegram Group


