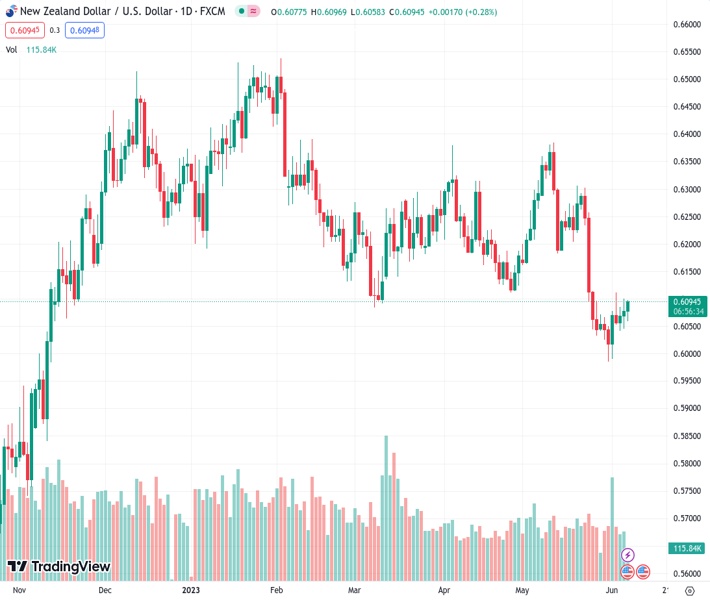
#NZDUSD @ 0.60961 has turned sideways broadly amid an absence of a potential trigger. (Pivot Orderbook analysis)
…
This is a premium post.
[s2If !current_user_can(access_s2member_level4)]Please register for FREE REGISTER to read full post below containing analysis. In case of any error or you think you are not able to read the full post below, please email us at support#nehcap.com [lwa][/s2If] [s2If current_user_can(access_s2member_level1)]
- NZD/USD has turned sideways broadly amid an absence of a potential trigger.
- The US Dollar Index has resumed its downside journey after a less-confident pullback move to near 104.00.
- NZD/USD is auctioning in a Symmetrical Triangle that indicates a contraction in volatility.
The pair currently trades last at 0.60961.
The previous day high was 0.61 while the previous day low was 0.6045. The daily 38.2% Fib levels comes at 0.6079, expected to provide support. Similarly, the daily 61.8% fib level is at 0.6066, expected to provide support.
The NZD/USD pair is demonstrating topsy-turvy moves in the early New York session. The Kiwi asset is auctioning in a tight range as investors are divided about the Federal Reserve (Fed)’s interest rate policy for June.
While the United States’ solid labor market conditions are propelling the continuation of the rate-hiking spell by the Fed, deteriorating economic activities are telling a different story. The US Dollar Index (DXY) has resumed its downside journey after a less-confident pullback move to near 104.00.
The risk-on market mood has improved the appeal of the risk-perceived assets.
NZD/USD is auctioning in a Symmetrical Triangle chart pattern that indicates a contraction in volatility, which is followed by wider ticks and heavy volume after an explosion. The upward-sloping trendline of the aforementioned chart pattern is plotted from June 05 low at 0.6041 while the downward-sloping trendline is placed from June 02 high at 0.6112.
The 20-period Exponential Moving Average (EMA) at 0.6075 seems sticky to the asset, indicating a sideways performance.
Also, the Relative Strength Index (RSI) (14) has been confined into the 40.00-60.00 range, which signals that investors are awaiting a fresh trigger for a decisive move.
A confident break above May 25 high at 0.6110 will drive the Kiwi asset toward May 01 low at 0.6160 followed by the round-level resistance at 0.6200.
Alternatively, a downside move below the intraday low at 0.6015 will expose the asset for a fresh six-month low toward 11 November 2022 low at 0.5984. A slippage below the latter would expose the asset toward 02 November 2022 high at 0.5941.
Technical Levels: Supports and Resistances
NZDUSD currently trading at 0.6067 at the time of writing. Pair opened at 0.6078 and is trading with a change of -0.18 % .
| Overview | Overview.1 | |
|---|---|---|
| 0 | Today last price | 0.6067 |
| 1 | Today Daily Change | -0.0011 |
| 2 | Today Daily Change % | -0.1800 |
| 3 | Today daily open | 0.6078 |
The pair remains strongly bearish on the daily time frame. It trades below the 20 SMA @ 0.6154, 50 SMA 0.6198, 100 SMA @ 0.6244 and 200 SMA @ 0.6149.
| Trends | Trends.1 | |
|---|---|---|
| 0 | Daily SMA20 | 0.6154 |
| 1 | Daily SMA50 | 0.6198 |
| 2 | Daily SMA100 | 0.6244 |
| 3 | Daily SMA200 | 0.6149 |
The previous day high was 0.61 while the previous day low was 0.6045. The daily 38.2% Fib levels comes at 0.6079, expected to provide support. Similarly, the daily 61.8% fib level is at 0.6066, expected to provide support.
Note the levels of interest below:
- Pivot support is noted at 0.6049, 0.6019, 0.5993
- Pivot resistance is noted at 0.6104, 0.613, 0.616
| Levels | Levels.1 |
|---|---|
| Previous Daily High | 0.6100 |
| Previous Daily Low | 0.6045 |
| Previous Weekly High | 0.6112 |
| Previous Weekly Low | 0.5985 |
| Previous Monthly High | 0.6385 |
| Previous Monthly Low | 0.5985 |
| Daily Fibonacci 38.2% | 0.6079 |
| Daily Fibonacci 61.8% | 0.6066 |
| Daily Pivot Point S1 | 0.6049 |
| Daily Pivot Point S2 | 0.6019 |
| Daily Pivot Point S3 | 0.5993 |
| Daily Pivot Point R1 | 0.6104 |
| Daily Pivot Point R2 | 0.6130 |
| Daily Pivot Point R3 | 0.6160 |
[/s2If]
Nehcap Expert Advisor
The NEHCAP MT4 EA is high quality professional trading system geared to generate returns without using GRID or martingales. Each trade has strict risk per trade parameter. The pairs under management include EURUSD, GBPUSD, AUDCAD, AUDNZD,GBPAUD, EURAUD, EURCAD, CHFJPY and many more.
The system is trading live: LIVE ACCOUNT TRACKING
You can run it free. Apply for a free trial and track our account. Buy the system or use profit share mechanism to generate returns on your MT4.
Join Our Telegram Group


