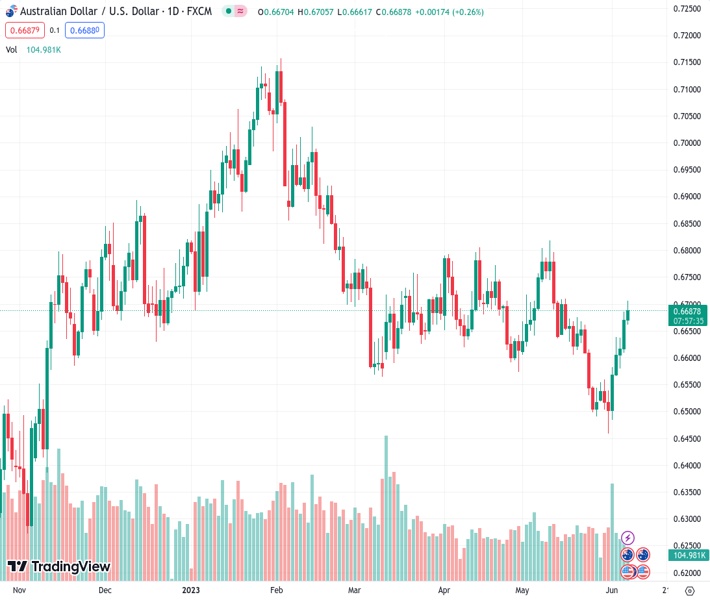
#AUDUSD @ 0.66882 is facing barricades in extending its rally above 0.6700, however, the upside bias is still solid. (Pivot Orderbook analysis)
…
This is a premium post.
[s2If !current_user_can(access_s2member_level4)]Please register for FREE REGISTER to read full post below containing analysis. In case of any error or you think you are not able to read the full post below, please email us at support#nehcap.com [lwa][/s2If] [s2If current_user_can(access_s2member_level1)]
- AUD/USD is facing barricades in extending its rally above 0.6700, however, the upside bias is still solid.
- Offers for the USD Index soared dramatically as investors are anticipating a pause in the policy-tightening spell by the Fed.
- AUD/USD is auctioning in a Rising Channel in which each corrective move is considered a buying opportunity.
The pair currently trades last at 0.66882.
The previous day high was 0.6685 while the previous day low was 0.661. The daily 38.2% Fib levels comes at 0.6656, expected to provide support. Similarly, the daily 61.8% fib level is at 0.6639, expected to provide support.
The AUD/USD pair is struggling in stretching its rally above the round-level resistance of 0.6700 in the early New York session. The Aussie asset is expected to climb above the aforementioned resistance confidently as the Reserve Bank of Australia (RBA) has opened room for further interest rate hikes to arrest stubborn Australian inflation.
S&P500 futures have added decent gains ahead of United States opening, portraying an upbeat market mood. The US Dollar Index (DXY) displayed a perpendicular fall after failing to recapture the previous day’s high at 104.30. Offers for the USD Index soared dramatically as investors are anticipating a pause in the policy-tightening spell by the Federal Reserve (Fed).
As per the CME Fedwatch tool, the chances of a neutral interest rate policy have jumped above 77%.
AUD/USD is auctioning in a Rising Channel on a two-hour scale in which each corrective move is considered as a buying opportunity by the market participants. The Aussie asset has comfortably shifted above the 61.8% Fibonacci retracement (plotted from May 10 high at 0.6818 to May 31 low at 0.6458) at 0.6682.
The Relative Strength Index (RSI) is oscillating in the bullish range of 60.00-80.00, indicating more upside ahead.
Should the Aussie asset confidently breaks above the round-level resistance of 0.6700, the Australian Dollar bulls will drive the asset toward April 18 high at 0.6748 followed by May 10 high at 0.6818.
On the flip side, if the Aussie asset breaks below June 01 low at 0.6484, US Dollar bulls would drag the asset to 01 November 2022 high around 0.6464 followed by the round-level support at 0.6400.
Technical Levels: Supports and Resistances
AUDUSD currently trading at 0.669 at the time of writing. Pair opened at 0.6672 and is trading with a change of 0.27 % .
| Overview | Overview.1 | |
|---|---|---|
| 0 | Today last price | 0.6690 |
| 1 | Today Daily Change | 0.0018 |
| 2 | Today Daily Change % | 0.2700 |
| 3 | Today daily open | 0.6672 |
The pair is trading above its 20 Daily moving average @ 0.6613, above its 50 Daily moving average @ 0.6662 , below its 100 Daily moving average @ 0.6748 and below its 200 Daily moving average @ 0.6692
| Trends | Trends.1 | |
|---|---|---|
| 0 | Daily SMA20 | 0.6613 |
| 1 | Daily SMA50 | 0.6662 |
| 2 | Daily SMA100 | 0.6748 |
| 3 | Daily SMA200 | 0.6692 |
The previous day high was 0.6685 while the previous day low was 0.661. The daily 38.2% Fib levels comes at 0.6656, expected to provide support. Similarly, the daily 61.8% fib level is at 0.6639, expected to provide support.
Note the levels of interest below:
- Pivot support is noted at 0.6626, 0.658, 0.655
- Pivot resistance is noted at 0.6702, 0.6731, 0.6777
| Levels | Levels.1 |
|---|---|
| Previous Daily High | 0.6685 |
| Previous Daily Low | 0.6610 |
| Previous Weekly High | 0.6639 |
| Previous Weekly Low | 0.6458 |
| Previous Monthly High | 0.6818 |
| Previous Monthly Low | 0.6458 |
| Daily Fibonacci 38.2% | 0.6656 |
| Daily Fibonacci 61.8% | 0.6639 |
| Daily Pivot Point S1 | 0.6626 |
| Daily Pivot Point S2 | 0.6580 |
| Daily Pivot Point S3 | 0.6550 |
| Daily Pivot Point R1 | 0.6702 |
| Daily Pivot Point R2 | 0.6731 |
| Daily Pivot Point R3 | 0.6777 |
[/s2If]
Nehcap Expert Advisor
The NEHCAP MT4 EA is high quality professional trading system geared to generate returns without using GRID or martingales. Each trade has strict risk per trade parameter. The pairs under management include EURUSD, GBPUSD, AUDCAD, AUDNZD,GBPAUD, EURAUD, EURCAD, CHFJPY and many more.
The system is trading live: LIVE ACCOUNT TRACKING
You can run it free. Apply for a free trial and track our account. Buy the system or use profit share mechanism to generate returns on your MT4.
Join Our Telegram Group


