#USDJPY @ 139.552 attracts some dip-buying and recovers a major part of its modest intraday losses. (Pivot Orderbook analysis)
…
This is a premium post.
[s2If !current_user_can(access_s2member_level4)]Please register for FREE REGISTER to read full post below containing analysis. In case of any error or you think you are not able to read the full post below, please email us at support#nehcap.com [lwa][/s2If] [s2If current_user_can(access_s2member_level1)]
- USD/JPY attracts some dip-buying and recovers a major part of its modest intraday losses.
- Rebounding US bond yields acts as a tailwind for the USD and lends support to the major.
- Economic woes, intervention fears could benefit the JPY and cap any meaningful upside.
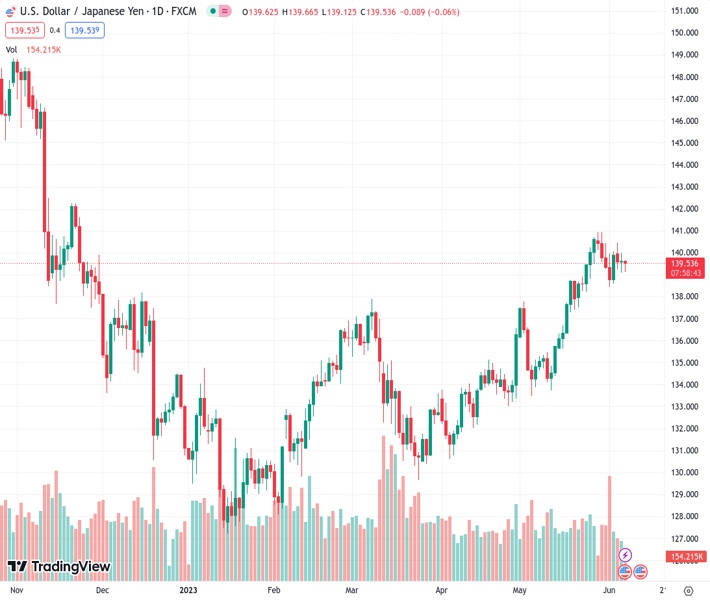
The pair currently trades last at 139.552.
The previous day high was 140.0 while the previous day low was 139.1. The daily 38.2% Fib levels comes at 139.65, expected to provide resistance. Similarly, the daily 61.8% fib level is at 139.44, expected to provide support.
The USD/JPY pair edges lower on Wednesday, albeit lacks any follow-through selling and remains confined in the previous day’s broader trading range. Spot prices manage to recover a major part of the intraday losses back closer to the weekly low set on Tuesday and hover just above mid-139.00s, nearly unchanged for the day during the early North American session.
A combination of factors provides a modest lift to the Japanese Yen (JPY), which, in turn, prompts some intraday selling around the USD/JPY pair. Disappointing Chinese data, showing that trade surplus sank to a 13-month low in May led by a surprise slump in exports on the back of weaker overseas demand for Chinese goods, weighs on investors’ sentiment. This is evident from the cautious mood around the equity markets and benefits traditional safe-haven assets, including the JPY.
Apart from this, speculations for more sizeable interventions by the Bank of Japan (BoJ) to support the domestic currency further underpin the JPY. This, along with the emergence of fresh US Dollar (USD) selling, contributes to the offered tone surrounding the USD/JPY pair. That said, the downside for the USD remains limited amid the uncertainty over the Federal Reserve’s (Fed) rate-hike path, which is holding back traders from placing aggressive near-term directional bets.
Last week’s dovish rhetoric by several Fed officials lifted bets for an imminent pause in the US central bank’s policy tightening cycle.
That said, the recent inflation and labor market data from the US kept alive hopes for a 25 bps lift-off at the June
FOMC meeting. This, in turn, acts as a tailwind for the US Treasury bond yields, which seems to offer some support to the Greenback and assist the USD/JPY pair to attract some dip-buying ahead of the 139.00 round-figure mark.
There isn’t any relevant market-moving economic data due for release from the US on Wednesday, leaving the USD at the mercy of the USD price dynamics. Apart from this, the broader risk sentiment will drive demand for the safe-haven JPY and provide some impetus to the USD/JPY pair. The range-bound price action witnessed since the beginning of the current week, meanwhile, warrants some caution before positioning for the next leg of a directional move.
Technical Levels: Supports and Resistances
USDJPY currently trading at 139.61 at the time of writing. Pair opened at 139.64 and is trading with a change of -0.02 % .
| Overview | Overview.1 | |
|---|---|---|
| 0 | Today last price | 139.61 |
| 1 | Today Daily Change | -0.03 |
| 2 | Today Daily Change % | -0.02 |
| 3 | Today daily open | 139.64 |
The pair remains strongly bullish on the daily timeframe. It trades above its 20 SMA @ 138.31, 50 SMA 135.65, 100 SMA @ 134.18 and 200 SMA @ 137.3.
| Trends | Trends.1 | |
|---|---|---|
| 0 | Daily SMA20 | 138.31 |
| 1 | Daily SMA50 | 135.65 |
| 2 | Daily SMA100 | 134.18 |
| 3 | Daily SMA200 | 137.30 |
The previous day high was 140.0 while the previous day low was 139.1. The daily 38.2% Fib levels comes at 139.65, expected to provide resistance. Similarly, the daily 61.8% fib level is at 139.44, expected to provide support.
Note the levels of interest below:
- Pivot support is noted at 139.16, 138.68, 138.26
- Pivot resistance is noted at 140.06, 140.48, 140.96
| Levels | Levels.1 |
|---|---|
| Previous Daily High | 140.00 |
| Previous Daily Low | 139.10 |
| Previous Weekly High | 140.93 |
| Previous Weekly Low | 138.43 |
| Previous Monthly High | 140.93 |
| Previous Monthly Low | 133.50 |
| Daily Fibonacci 38.2% | 139.65 |
| Daily Fibonacci 61.8% | 139.44 |
| Daily Pivot Point S1 | 139.16 |
| Daily Pivot Point S2 | 138.68 |
| Daily Pivot Point S3 | 138.26 |
| Daily Pivot Point R1 | 140.06 |
| Daily Pivot Point R2 | 140.48 |
| Daily Pivot Point R3 | 140.96 |
[/s2If]
Nehcap Expert Advisor
The NEHCAP MT4 EA is high quality professional trading system geared to generate returns without using GRID or martingales. Each trade has strict risk per trade parameter. The pairs under management include EURUSD, GBPUSD, AUDCAD, AUDNZD,GBPAUD, EURAUD, EURCAD, CHFJPY and many more.
The system is trading live: LIVE ACCOUNT TRACKING
You can run it free. Apply for a free trial and track our account. Buy the system or use profit share mechanism to generate returns on your MT4.
Join Our Telegram Group


