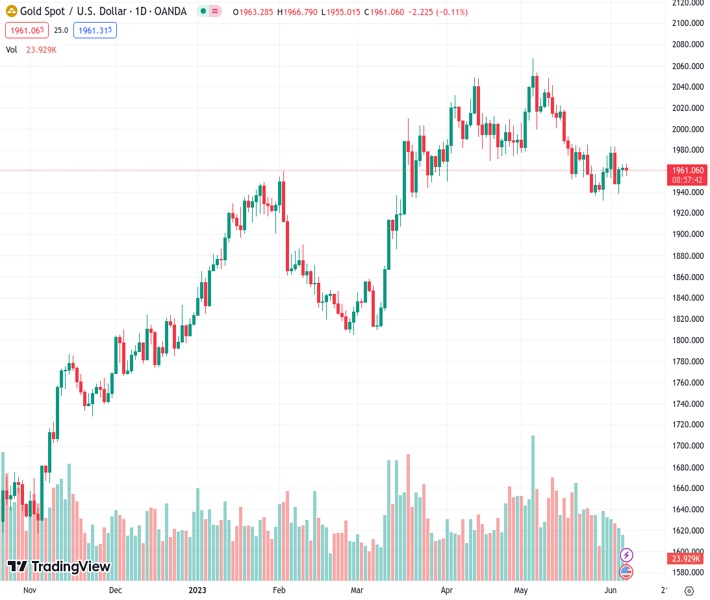
#XAUUSD @ 1,960.75 Gold price has recovered from a minor fall to near $1,956.00 but has turned choppy again. (Pivot Orderbook analysis)
…
This is a premium post.
[s2If !current_user_can(access_s2member_level4)]Please register for FREE REGISTER to read full post below containing analysis. In case of any error or you think you are not able to read the full post below, please email us at support#nehcap.com [lwa][/s2If] [s2If current_user_can(access_s2member_level1)]
- Gold price has recovered from a minor fall to near $1,956.00 but has turned choppy again.
- The Fed is more likely to leave rates unchanged, rather than cut them any time soon.
- Gold price is showing signs of sheer volatility contraction as the US economic calendar has nothing much to offer.
The pair currently trades last at 1960.75.
The previous day high was 1966.43 while the previous day low was 1954.43. The daily 38.2% Fib levels comes at 1961.85, expected to provide resistance. Similarly, the daily 61.8% fib level is at 1959.01, expected to provide support.
Gold price (XAU/USD) has returned inside the woods after an attempt at a downside break in the late European session. The precious metal recovered after dropping to near $1,956.00 but has turned choppy again amid an absence of potential triggers.
The recovery move in the Gold price was supported by the vertical sell-off in the US Dollar Index (DXY). The USD Index has slipped below 103.90 as expectations for a raise in interest rates by the Federal Reserve (Fed) have receded. While monetary policies of other central banks belonging to the G7 cartel are far from any sort of a pause amid persistence in inflation in their respective countries.
Analysts at Rabobank cited that given the Fed is more likely to leave rates unchanged, rather than cut them any time soon, the U.S. dollar is likely to boast a natural edge over other currencies for now.
Meanwhile, S&P500 futures have recovered their losses and have turned positive amid rising hopes that Fed chair Jerome Powell will keep interest rates steady. Also, Fed Powell cited last that more interest rate hikes are less appropriate as tight credit conditions are doing the job effectively. The risk appetite of the market participants has improved, which has increased the appeal for risk-perceived assets.
Gold price is showing signs of sheer volatility contraction as the US economic calendar has nothing much to offer. Investors should note that a squeeze in volatility is followed by an expansion in the same, which results in wider ticks and heavy volume.
On a broader note, Gold price is consolidating in a range of $1,932-1,985 for the past three weeks on a four-hour. Horizontal support is plotted from March 15 high at $1,937.39. The magical 200-period Exponential Moving Average (EMA) at $1,975.47 is acting as a strong barrier for the Gold bulls.
An oscillation in the 40.00-60.00 territory by the Relative Strength Index (RSI) (14) indicates a non-directional performance.
Technical Levels: Supports and Resistances
XAUUSD currently trading at 1962.45 at the time of writing. Pair opened at 1963.6 and is trading with a change of -0.06 % .
| Overview | Overview.1 | |
|---|---|---|
| 0 | Today last price | 1962.45 |
| 1 | Today Daily Change | -1.15 |
| 2 | Today Daily Change % | -0.06 |
| 3 | Today daily open | 1963.60 |
The pair is trading below its 20 Daily moving average @ 1974.4, below its 50 Daily moving average @ 1991.22 , above its 100 Daily moving average @ 1940.0 and above its 200 Daily moving average @ 1837.93
| Trends | Trends.1 | |
|---|---|---|
| 0 | Daily SMA20 | 1974.40 |
| 1 | Daily SMA50 | 1991.22 |
| 2 | Daily SMA100 | 1940.00 |
| 3 | Daily SMA200 | 1837.93 |
The previous day high was 1966.43 while the previous day low was 1954.43. The daily 38.2% Fib levels comes at 1961.85, expected to provide resistance. Similarly, the daily 61.8% fib level is at 1959.01, expected to provide support.
Note the levels of interest below:
- Pivot support is noted at 1956.54, 1949.49, 1944.54
- Pivot resistance is noted at 1968.54, 1973.49, 1980.54
| Levels | Levels.1 |
|---|---|
| Previous Daily High | 1966.43 |
| Previous Daily Low | 1954.43 |
| Previous Weekly High | 1983.50 |
| Previous Weekly Low | 1932.12 |
| Previous Monthly High | 2079.76 |
| Previous Monthly Low | 1932.12 |
| Daily Fibonacci 38.2% | 1961.85 |
| Daily Fibonacci 61.8% | 1959.01 |
| Daily Pivot Point S1 | 1956.54 |
| Daily Pivot Point S2 | 1949.49 |
| Daily Pivot Point S3 | 1944.54 |
| Daily Pivot Point R1 | 1968.54 |
| Daily Pivot Point R2 | 1973.49 |
| Daily Pivot Point R3 | 1980.54 |
[/s2If]
Nehcap Expert Advisor
The NEHCAP MT4 EA is high quality professional trading system geared to generate returns without using GRID or martingales. Each trade has strict risk per trade parameter. The pairs under management include EURUSD, GBPUSD, AUDCAD, AUDNZD,GBPAUD, EURAUD, EURCAD, CHFJPY and many more.
The system is trading live: LIVE ACCOUNT TRACKING
You can run it free. Apply for a free trial and track our account. Buy the system or use profit share mechanism to generate returns on your MT4.
Join Our Telegram Group


