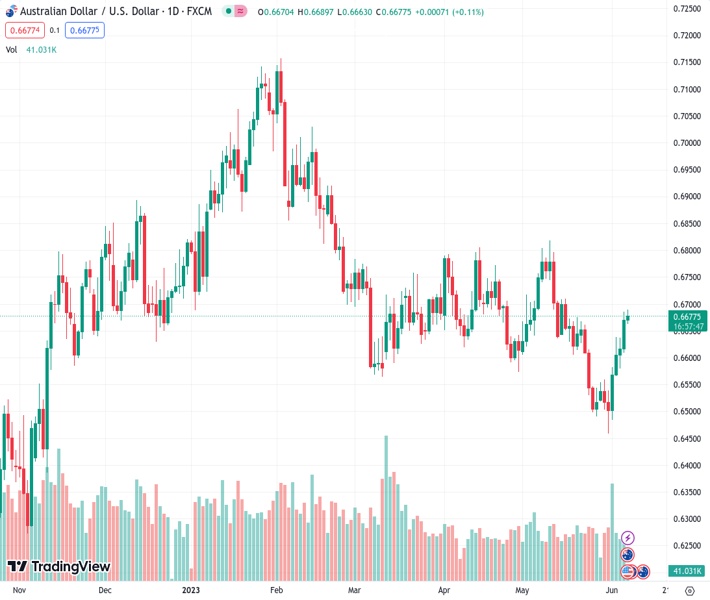
#AUDUSD @ 0.66753 fades upside momentum at the highest levels in three weeks, prods intraday low of late., @nehcap view: Further downside expected (Pivot Orderbook analysis)
…
This is a premium post.
[s2If !current_user_can(access_s2member_level4)]Please register for FREE REGISTER to read full post below containing analysis. In case of any error or you think you are not able to read the full post below, please email us at support#nehcap.com [lwa][/s2If] [s2If current_user_can(access_s2member_level1)]
- AUD/USD fades upside momentum at the highest levels in three weeks, prods intraday low of late.
- China trade surplus eases, imports increase but exports drop in May.
- 61.8% Fibonacci retracement prods Aussie buyers amid overbought RSI conditions.
- Sellers need validation from convergence of 200-SMA, 50% Fibonacci retracement level.
The pair currently trades last at 0.66753.
The previous day high was 0.6685 while the previous day low was 0.661. The daily 38.2% Fib levels comes at 0.6656, expected to provide support. Similarly, the daily 61.8% fib level is at 0.6639, expected to provide support.
AUD/USD bulls struggle to keep the reins as China trade numbers join downbeat Australia’s first quarter (Q1) Gross Domestic Product (GDP) to prod the upside momentum at the highest levels in three weeks. That said, the Aussie pair retreats towards the intraday low surrounding 0.6670 heading into Wednesday’s European session.
China’s headline Trade Balance deteriorates to $65.81 billion versus the $92.0 billion expected and $90.21 billion previous readings. That said, the Exports and Imports came in mixed with the former falling past -0.4% expected and 8.5% previous readings to -7.5% YoY whereas the latter improves to 2.3% from -0.8% market forecasts and 4.2% prior.
On the other hand, Aussie Q1 GDP rose 0.2% QoQ compared to 0.5% previous readings and 0.3% market forecasts. On the same line, the yearly GDP came in as 2.3% versus the analysts’ estimation of 2.4% YoY and 2.7% previous readings.
Technically, the Aussie pair portrays a rising wedge bearish chart pattern on the four-hour play while recently reversing from the 61.8% Fibonacci retracement of its May 10-31 downturn, also known as the golden Fibonacci ratio.
That said, the risk-barometer pair’s reversal from the key Fibonacci ratio also justifies the overbought RSI (14) line to tease the sellers.
However, a clear downside break of the stated wedge’s bottom line, close to 0.6650 at the latest, becomes necessary for the AUD/USD bears to retake control.
Even so, a convergence of the 200-SMA and 50% Fibonacci retracement level of around 0.6640-35, appears a tough nut to crack for the AUD/USD sellers.
On the flip side, a successful break of the 61.8% Fibonacci retracement level of 0.6680 needs validation from the stated wedge’s top line, close to the 0.6700 round figure by the press time, to recall the AUD/USD buyers.
Also acting as an upside filter is the mid-May swing high around 0.6710.
Trend: Further downside expected
Technical Levels: Supports and Resistances
AUDUSD currently trading at 0.6672 at the time of writing. Pair opened at 0.6672 and is trading with a change of 0.00% % .
| Overview | Overview.1 | |
|---|---|---|
| 0 | Today last price | 0.6672 |
| 1 | Today Daily Change | 0.0000 |
| 2 | Today Daily Change % | 0.00% |
| 3 | Today daily open | 0.6672 |
The pair is trading above its 20 Daily moving average @ 0.6613, above its 50 Daily moving average @ 0.6662 , below its 100 Daily moving average @ 0.6748 and below its 200 Daily moving average @ 0.6692
| Trends | Trends.1 | |
|---|---|---|
| 0 | Daily SMA20 | 0.6613 |
| 1 | Daily SMA50 | 0.6662 |
| 2 | Daily SMA100 | 0.6748 |
| 3 | Daily SMA200 | 0.6692 |
The previous day high was 0.6685 while the previous day low was 0.661. The daily 38.2% Fib levels comes at 0.6656, expected to provide support. Similarly, the daily 61.8% fib level is at 0.6639, expected to provide support.
Note the levels of interest below:
- Pivot support is noted at 0.6626, 0.658, 0.655
- Pivot resistance is noted at 0.6702, 0.6731, 0.6777
| Levels | Levels.1 |
|---|---|
| Previous Daily High | 0.6685 |
| Previous Daily Low | 0.6610 |
| Previous Weekly High | 0.6639 |
| Previous Weekly Low | 0.6458 |
| Previous Monthly High | 0.6818 |
| Previous Monthly Low | 0.6458 |
| Daily Fibonacci 38.2% | 0.6656 |
| Daily Fibonacci 61.8% | 0.6639 |
| Daily Pivot Point S1 | 0.6626 |
| Daily Pivot Point S2 | 0.6580 |
| Daily Pivot Point S3 | 0.6550 |
| Daily Pivot Point R1 | 0.6702 |
| Daily Pivot Point R2 | 0.6731 |
| Daily Pivot Point R3 | 0.6777 |
[/s2If]
Nehcap Expert Advisor
The NEHCAP MT4 EA is high quality professional trading system geared to generate returns without using GRID or martingales. Each trade has strict risk per trade parameter. The pairs under management include EURUSD, GBPUSD, AUDCAD, AUDNZD,GBPAUD, EURAUD, EURCAD, CHFJPY and many more.
The system is trading live: LIVE ACCOUNT TRACKING
You can run it free. Apply for a free trial and track our account. Buy the system or use profit share mechanism to generate returns on your MT4.
Join Our Telegram Group


