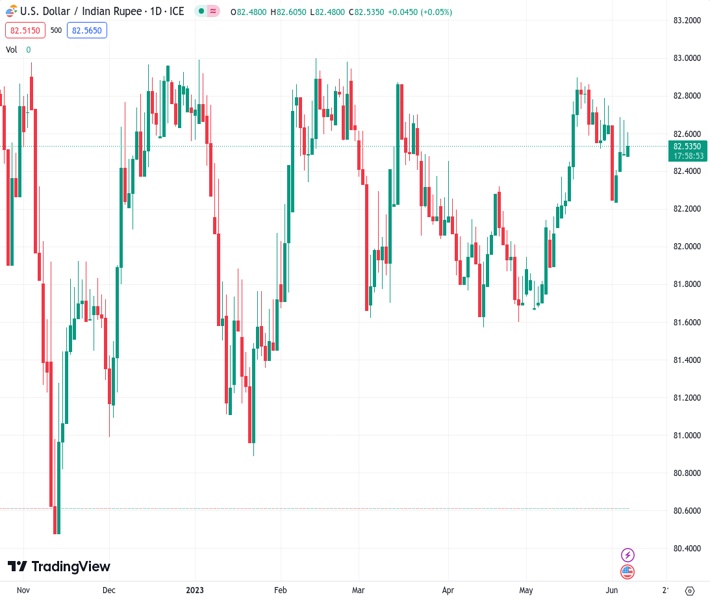
#USDINR @ 82.5390 picks up bids to brace for the first weekly gain in three. (Pivot Orderbook analysis)
…
This is a premium post.
[s2If !current_user_can(access_s2member_level4)]Please register for FREE REGISTER to read full post below containing analysis. In case of any error or you think you are not able to read the full post below, please email us at support#nehcap.com [lwa][/s2If] [s2If current_user_can(access_s2member_level1)]
- USD/INR picks up bids to brace for the first weekly gain in three.
- Firmer Oil price, dovish hopes from RBI underpin bearish bias surrounding Indian Rupee.
- US Dollar struggles to find traction amid light calendar, pre-Fed blackout.
- Increase in July Fed rate hike bets put a floor under USD/INR price during dicey markets.
The pair currently trades last at 82.5390.
The previous day high was 82.712 while the previous day low was 82.4925. The daily 38.2% Fib levels comes at 82.5763, expected to provide resistance. Similarly, the daily 61.8% fib level is at 82.6282, expected to provide resistance.
USD/INR clings to mild gains around 82.55 as it defies the previous day’s Doji candlestick amid early Wednesday. In doing so, the Indian Rupee (INR) pair seems to justify the market’s dovish hopes from the Reserve Bank of India (RBI) ahead of Thursday’s monetary policy decision.
In this matter, Reuters said that the RBI decision is due on Thursday when it is expected to leave the repo rate unchanged at 6.50% after having surprised markets by holding rates in April. It should be noted that the news also quotes an anonymous trader who said, “RBI rate decision could ‘lend some volatility,’ but “there was no way” it will change the current status quo on USD/INR.”
Apart from the RBI’s likely status quo, recent improvements in the prices of WTI crude oil, India’s major import item, also weigh on the Indian Rupee and propel the USD/INR price. That said, WTI crude oil remains mildly bid near $71.70 as it justifies a downbeat US Dollar and a surprise draw in the weekly Oil inventory data from the American Petroleum Institute (API). It should be noted that the global oil producers’ readiness for further output cuts joins improvement in China data to underpin the upbeat bias surrounding the black gold which is also a major export earner for Canada.
Elsewhere, US Dollar Index (DXY) struggles to defend the previous day’s corrective bounce while making rounds to 104.10, mostly indecisive on a day by the press time. In doing so, the greenback’s gauge versus six major currencies suffers from downbeat market bets on the Fed’s next move amid the pre-FOMC blackout for the policymakers. That said, the interest rate futures show a nearly 15% probability of a June rate hike. The reason could be linked to downbeat United States activity data released on Monday, as well as the previously dovish comments from the Federal Reserve (Fed) Officials ahead of the pre-Fed blackout.
It should be noted that the recent weakness in China’s trade numbers and previously positive PMIs raise concern about the market’s future and hence weigh on the INR amid the indecision.
Looking ahead, a light calendar and absence of Fed talks can restrict the USD/INR moves while the pre-RBI anxiety adds strength to the trading restrictions. Even so, a surprise rate hike from the RBI, which is least expected due to the recent easing in Indian inflation, can trigger the Indian Rupee’s rebound from the technical level mentioned below.
USD/INR pair’s recovery from the 50-day Exponential Moving Average (EMA), around 82.30 by the press time, needs validation from a two-week-old resistance line, near 82.60 at the latest, to convince the buyers.
Technical Levels: Supports and Resistances
USDINR currently trading at 82.5515 at the time of writing. Pair opened at 82.5241 and is trading with a change of 0.03% % .
| Overview | Overview.1 | |
|---|---|---|
| 0 | Today last price | 82.5515 |
| 1 | Today Daily Change | 0.0274 |
| 2 | Today Daily Change % | 0.03% |
| 3 | Today daily open | 82.5241 |
The pair remains strongly bullish on the daily timeframe. It trades above its 20 SMA @ 82.5178, 50 SMA 82.1734, 100 SMA @ 82.2144 and 200 SMA @ 81.9497.
| Trends | Trends.1 | |
|---|---|---|
| 0 | Daily SMA20 | 82.5178 |
| 1 | Daily SMA50 | 82.1734 |
| 2 | Daily SMA100 | 82.2144 |
| 3 | Daily SMA200 | 81.9497 |
The previous day high was 82.712 while the previous day low was 82.4925. The daily 38.2% Fib levels comes at 82.5763, expected to provide resistance. Similarly, the daily 61.8% fib level is at 82.6282, expected to provide resistance.
Note the levels of interest below:
- Pivot support is noted at 82.4404, 82.3567, 82.2209
- Pivot resistance is noted at 82.6599, 82.7957, 82.8794
| Levels | Levels.1 |
|---|---|
| Previous Daily High | 82.7120 |
| Previous Daily Low | 82.4925 |
| Previous Weekly High | 82.8046 |
| Previous Weekly Low | 82.2615 |
| Previous Monthly High | 82.9810 |
| Previous Monthly Low | 81.6435 |
| Daily Fibonacci 38.2% | 82.5763 |
| Daily Fibonacci 61.8% | 82.6282 |
| Daily Pivot Point S1 | 82.4404 |
| Daily Pivot Point S2 | 82.3567 |
| Daily Pivot Point S3 | 82.2209 |
| Daily Pivot Point R1 | 82.6599 |
| Daily Pivot Point R2 | 82.7957 |
| Daily Pivot Point R3 | 82.8794 |
[/s2If]
Nehcap Expert Advisor
The NEHCAP MT4 EA is high quality professional trading system geared to generate returns without using GRID or martingales. Each trade has strict risk per trade parameter. The pairs under management include EURUSD, GBPUSD, AUDCAD, AUDNZD,GBPAUD, EURAUD, EURCAD, CHFJPY and many more.
The system is trading live: LIVE ACCOUNT TRACKING
You can run it free. Apply for a free trial and track our account. Buy the system or use profit share mechanism to generate returns on your MT4.
Join Our Telegram Group


