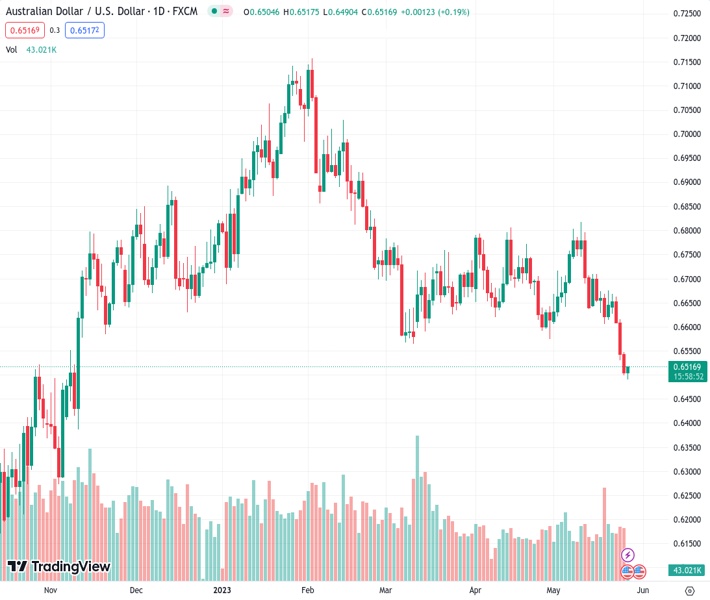
#AUDUSD @ 0.65173 bounce off six-month low towards 0.6550 on US Dollar’s retreat, ignores Aussie data (Pivot Orderbook analysis)
…
This is a premium post.
[s2If !current_user_can(access_s2member_level4)]Please register for FREE REGISTER to read full post below containing analysis. In case of any error or you think you are not able to read the full post below, please email us at support#nehcap.com [lwa][/s2If] [s2If current_user_can(access_s2member_level1)]
The pair currently trades last at 0.65173.
The previous day high was 0.6547 while the previous day low was 0.6498. The daily 38.2% Fib levels comes at 0.6517, expected to provide support. Similarly, the daily 61.8% fib level is at 0.6529, expected to provide resistance.
AUD/USD prints the first daily gain in four as it rebounds from the yearly low to 0.6515 heading into Friday’s European session. In doing so, the Aussie pair pays little heed to the downbeat Australian data while cheering the US Dollar’s pullback.
Australia’s Retail Sales growth dropped to 0.0% in April versus 0.2% market forecasts and 0.4% prior.
It should be noted that the US Dollar Index (DXY) retreats from a 2.5-month high to 104.17 by the press time as US policymakers’ inability to clinch a deal on the US debt ceiling extension contrasts with the chatters suggesting a $70.0 billion gap left to be filled by the negotiators to get the much-awaited deal. Recently, US House Speaker Kevin McCarthy announced no agreement on the debt deal, as well as the continuation of talks by saying, “It’s hard. But we’re working and we’re going to continue to work until we get this done.”
An impressive tone of the Federal Reserve (Fed) officials, despite upbeat US data, prods the US Dollar bulls ahead of another round of key statistics.
On a different page, China’s FX intervention and slightly positive mood in the Asia-Pacific region, despite doubts about the Reserve Bank of Australia’s (RBA) hawkish moves, also underpin the AUD/USD pair’s corrective bounce.
That said, the second estimation of the US Annualized Gross Domestic Product (GDP) for Q1 2023 was revised up to 1.3% versus 1.0% first forecasts. Further, the Chicago Fed National Activity Index for April improved to 0.07 from -0.37 prior and -0.02 market estimations. On the same line, Kansad Fed Manufacturing Activity improved to -2 for May compared to -21 previous readings and analysts’ estimations of -11. It’s worth noting that the US Pending Home Sales for April improved on YoY but eased on MoM whereas Core Personal Consumption Expenditures also rose to 5.0% during the preliminary readings versus 4.9% prior.
Following the data, Richmond Fed President Thomas Barkin said, “Fed is in a test and learn situation to determine how slowing demand lowers inflation.” On the different front, Boston Federal Reserve President Susan Collins said on Thursday that the Fed “may be at or near” the time to pause interest rate increases, as reported by Reuters.
Against this backdrop, the US stock futures print mild losses while the Asia-Pacific equities edge higher. Further, the US Treasury bond yields retreat from the multi-day top.
Looking ahead, market sentiment dwindles and allows traders to brace for the key data including the US Durable Goods Orders for April and the Core Personal Consumption Expenditure (PCE) Price Index for the said month, known as the Fed’s preferred inflation gauge.
A downward-sloping support line from December 2022, close to 0.6495 at the latest, puts a floor under the AUD/USD prices amid an oversold RSI (14). The pair’s recovery, however, remains elusive unless crossing March’s low of around 0.6565.
Technical Levels: Supports and Resistances
AUDUSD currently trading at 0.6515 at the time of writing. Pair opened at 0.6505 and is trading with a change of 0.15% % .
| Overview | Overview.1 | |
|---|---|---|
| 0 | Today last price | 0.6515 |
| 1 | Today Daily Change | 0.0010 |
| 2 | Today Daily Change % | 0.15% |
| 3 | Today daily open | 0.6505 |
The pair remains strongly bearish on the daily time frame. It trades below the 20 SMA @ 0.6665, 50 SMA 0.6681, 100 SMA @ 0.6778 and 200 SMA @ 0.6706.
| Trends | Trends.1 | |
|---|---|---|
| 0 | Daily SMA20 | 0.6665 |
| 1 | Daily SMA50 | 0.6681 |
| 2 | Daily SMA100 | 0.6778 |
| 3 | Daily SMA200 | 0.6706 |
The previous day high was 0.6547 while the previous day low was 0.6498. The daily 38.2% Fib levels comes at 0.6517, expected to provide support. Similarly, the daily 61.8% fib level is at 0.6529, expected to provide resistance.
Note the levels of interest below:
- Pivot support is noted at 0.6487, 0.6468, 0.6438
- Pivot resistance is noted at 0.6535, 0.6566, 0.6584
| Levels | Levels.1 |
|---|---|
| Previous Daily High | 0.6547 |
| Previous Daily Low | 0.6498 |
| Previous Weekly High | 0.6710 |
| Previous Weekly Low | 0.6605 |
| Previous Monthly High | 0.6806 |
| Previous Monthly Low | 0.6574 |
| Daily Fibonacci 38.2% | 0.6517 |
| Daily Fibonacci 61.8% | 0.6529 |
| Daily Pivot Point S1 | 0.6487 |
| Daily Pivot Point S2 | 0.6468 |
| Daily Pivot Point S3 | 0.6438 |
| Daily Pivot Point R1 | 0.6535 |
| Daily Pivot Point R2 | 0.6566 |
| Daily Pivot Point R3 | 0.6584 |
[/s2If]
Nehcap Expert Advisor
The NEHCAP MT4 EA is high quality professional trading system geared to generate returns without using GRID or martingales. Each trade has strict risk per trade parameter. The pairs under management include EURUSD, GBPUSD, AUDCAD, AUDNZD,GBPAUD, EURAUD, EURCAD, CHFJPY and many more.
The system is trading live: LIVE ACCOUNT TRACKING
You can run it free. Apply for a free trial and track our account. Buy the system or use profit share mechanism to generate returns on your MT4.
Join Our Telegram Group
")


