#USDINR @ 82.7030 is oscillating in a narrow range below 83.00 as investors turn cautious due to unresolved US debt-ceiling issues. (Pivot Orderbook analysis)
…
This is a premium post.
[s2If !current_user_can(access_s2member_level4)]Please register for FREE REGISTER to read full post below containing analysis. In case of any error or you think you are not able to read the full post below, please email us at support#nehcap.com [lwa][/s2If] [s2If current_user_can(access_s2member_level1)]
- USD/INR is oscillating in a narrow range below 83.00 as investors turn cautious due to unresolved US debt-ceiling issues.
- The RBI is expected to hold interest rates ahead as India’s inflation is decelerating.
- USD/INR is marching towards the horizontal resistance of the Ascending Triangle pattern.
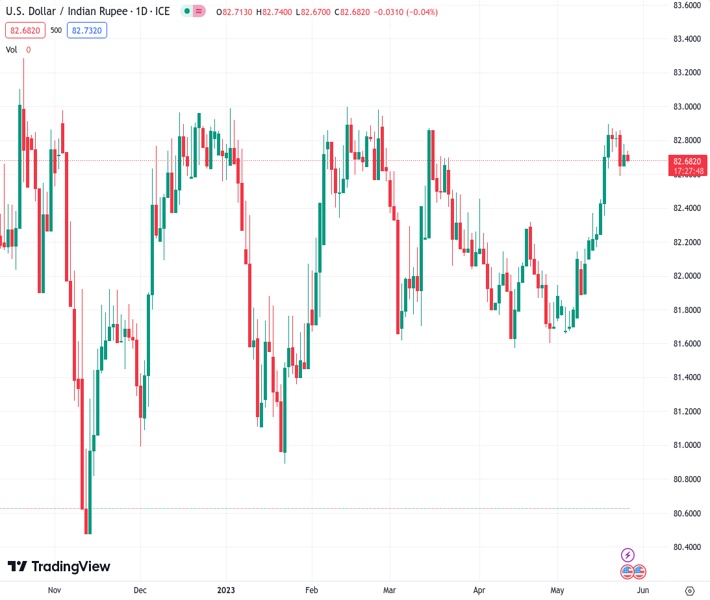
The pair currently trades last at 82.7030.
The previous day high was 82.8296 while the previous day low was 82.673. The daily 38.2% Fib levels comes at 82.7698, expected to provide resistance. Similarly, the daily 61.8% fib level is at 82.7328, expected to provide resistance.
The USD/INR pair is displaying a back-and-forth action below the critical resistance of 82.80 in the Asian session. The asset is expected to remain on the tenterhooks as the market mood is quite cautious due to unending negotiations over raising the current $31.4 trillion US borrowing cap limit.
The US Dollar Index (DXY) is declining towards the immediate cushion of 104.00 after a perpendicular rally as the focus has shifted to the US Durable Goods Orders data.
On the Indian Rupee front, investors are shifting their focus to the interest rate decision by the Reserve Bank of India (RBI), which is scheduled in the first week of June. Analysts at Commerzbank believe inflation in India is also showing signs of peaking, with headline inflation dipping back to the 2-6% target range in April. This provides RBI scope to stay on hold for the foreseeable future. At the same time, it is too early to discuss rate cuts by RBI.
USD/INR is marching towards the horizontal resistance of the Ascending Triangle chart pattern forming on the daily scale. The horizontal resistance of the aforementioned chart pattern is plotted from 03 November 2022 high at 83.18. While the upward-sloping trendline is plotted from 11 November 2022 low at 80.38.
Upward-sloping 10-period Exponential Moving Average (EMA) at 82.62 is providing a cushion to the US Dollar bulls.
The Relative Strength Index (RSI) (14) is oscillating in the bullish range of 60.00-80.00, which indicates that the upside momentum is already active.
For an upside move, a decisive break above May 23 high at 82.97 will drive the asset toward 03 November 2022 high at 83.18 followed by all-time high at 83.42.
In an alternate scenario, a downside move below May 24 low at 82.57 will further drag the asset toward 29 September 2022 high at 82.22. A slippage below the latter will further drag the asst toward the round-level support at 82.00.
Technical Levels: Supports and Resistances
USDINR currently trading at 82.7175 at the time of writing. Pair opened at 82.7399 and is trading with a change of -0.03 % .
| Overview | Overview.1 | |
|---|---|---|
| 0 | Today last price | 82.7175 |
| 1 | Today Daily Change | -0.0224 |
| 2 | Today Daily Change % | -0.0300 |
| 3 | Today daily open | 82.7399 |
The pair remains strongly bullish on the daily timeframe. It trades above its 20 SMA @ 82.2236, 50 SMA 82.1531, 100 SMA @ 82.143 and 200 SMA @ 81.8433.
| Trends | Trends.1 | |
|---|---|---|
| 0 | Daily SMA20 | 82.2236 |
| 1 | Daily SMA50 | 82.1531 |
| 2 | Daily SMA100 | 82.1430 |
| 3 | Daily SMA200 | 81.8433 |
The previous day high was 82.8296 while the previous day low was 82.673. The daily 38.2% Fib levels comes at 82.7698, expected to provide resistance. Similarly, the daily 61.8% fib level is at 82.7328, expected to provide resistance.
Note the levels of interest below:
- Pivot support is noted at 82.6655, 82.591, 82.509
- Pivot resistance is noted at 82.822, 82.904, 82.9784
| Levels | Levels.1 |
|---|---|
| Previous Daily High | 82.8296 |
| Previous Daily Low | 82.6730 |
| Previous Weekly High | 82.9554 |
| Previous Weekly Low | 82.1655 |
| Previous Monthly High | 82.5092 |
| Previous Monthly Low | 81.4850 |
| Daily Fibonacci 38.2% | 82.7698 |
| Daily Fibonacci 61.8% | 82.7328 |
| Daily Pivot Point S1 | 82.6655 |
| Daily Pivot Point S2 | 82.5910 |
| Daily Pivot Point S3 | 82.5090 |
| Daily Pivot Point R1 | 82.8220 |
| Daily Pivot Point R2 | 82.9040 |
| Daily Pivot Point R3 | 82.9784 |
[/s2If]
Nehcap Expert Advisor
The NEHCAP MT4 EA is high quality professional trading system geared to generate returns without using GRID or martingales. Each trade has strict risk per trade parameter. The pairs under management include EURUSD, GBPUSD, AUDCAD, AUDNZD,GBPAUD, EURAUD, EURCAD, CHFJPY and many more.
The system is trading live: LIVE ACCOUNT TRACKING
You can run it free. Apply for a free trial and track our account. Buy the system or use profit share mechanism to generate returns on your MT4.
Join Our Telegram Group
")


