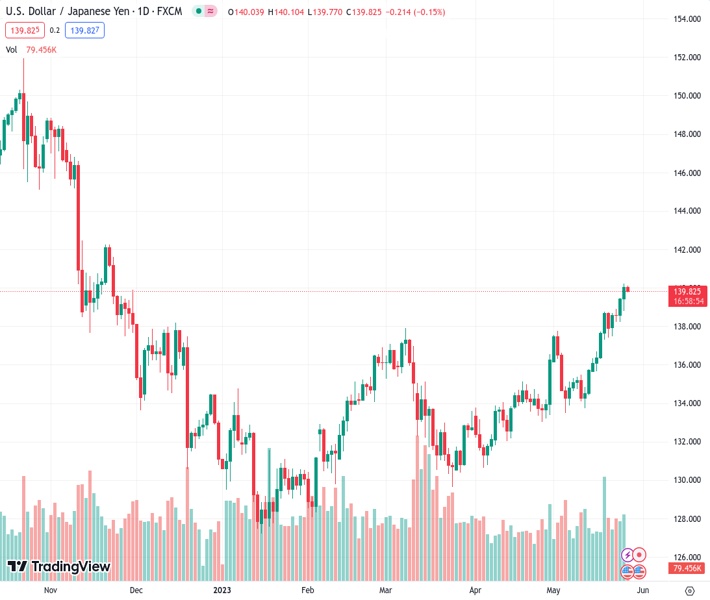
#USDJPY @ 139.843 has shifted comfortably below 140.00 amid an extended correction in the USD index. (Pivot Orderbook analysis)
…
This is a premium post.
[s2If !current_user_can(access_s2member_level4)]Please register for FREE REGISTER to read full post below containing analysis. In case of any error or you think you are not able to read the full post below, please email us at support#nehcap.com [lwa][/s2If] [s2If current_user_can(access_s2member_level1)]
- USD/JPY has shifted comfortably below 140.00 amid an extended correction in the USD index.
- FOMC minutes dictated that several Federal Reserve policymakers cited that more interest rates are less certain.
- Bank of Japan has remained room open for shortening the duration of bond yield targets to a 5-year zone from the current 10-year as a part of YCC.
- USD/JPY has added significant gains after delivering a breakout of the Ascending Triangle pattern.
The pair currently trades last at 139.843.
The previous day high was 140.23 while the previous day low was 138.82. The daily 38.2% Fib levels comes at 139.69, expected to provide support. Similarly, the daily 61.8% fib level is at 139.36, expected to provide support.
The USD/JPY pair has shifted its auction below the crucial support of 140.00 in the Asian session. The asset turned delicate following the footprints of the US Dollar Index (DXY). The USD Index has extended its correction to near 104.11 after failing to hold a fresh two-month high at 104.31. The correction in the USD/JPY pair seems higher in proportion than the correction in the USD index, which also indicates that the Japanese Yen has also gained some strength.
S&P500 futures have extended losses in the Asian session, portraying an extension in the risk-aversion theme. US equities were significantly bought on Thursday led by a solid recovery in technology and financial stocks. Meanwhile, investors are getting anxious as negotiations among White House officials and Republican leaders seem never-ending due to which the United States economy is approaching a default situation swiftly.
Fears of a default by the US economy are fueling gains in US Treasury yields. The yields offered on 10-year US government bonds have climbed above 3.83%.
On Friday, a power-pack action is expected from the USD Index amid the release of the US Durables Goods Orders data (April). The economic data is seen contracting by 1.0% against an expansion of 3.2% reported earlier.
Plenty of economic indicators in the United States economy are appealing for a pause in the policy-tightening spell by the Federal Reserve (Fed) in its June monetary policy meeting. US labor market conditions have started releasing heat, Consumer Price Index (CPI) is consistently decelerating, and firms are anticipating a bleak economic outlook. On Thursday, Reuters reported that weekly Federal Reserve emergency lending to banks fell to its lowest level since the banking sector ran into trouble in March. This indicates that firms are deploying their retained earnings to cater to their working capital requirements to avoid higher interest rates or are operating at a lower capacity.
Investors should note that minutes from May’s Federal Open Market Committee (FOMC) dictate that several Federal Reserve policymakers cited that more interest rates are less certain due to tight credit conditions by US regional banks.
Expectations of a hold in the rate-hiking spell for June got more solid after dovish commentary from Boston Federal Reserve Bank President Susan Collins said on Thursday that the Federal Reserve “may be at or near” the time to pause interest rate increases, as reported by Reuters. She further added, “While inflation is still too high, there are some promising signs of moderation,”
Bank of Japan (BoJ) Governor Kazuo Ueda said on Thursday that they could tweak the Yield Curve Control (YCC) strategy if the balance between the benefit and the cost of the policy were to shift. The Bank of Japan has remained room open for shortening the duration of bond yield targets to a 5-year zone from the current 10-year as a part of YCC.
Meanwhile, the Japanese Yen has got some strength after the release of decelerated Tokyo CPI (May) data. Headline inflation has softened to 3.2% from the prior release of 3.5% while the street was anticipating acceleration to 3.9%. Core CPI that excludes oil and food prices landed lower at 3.9% vs. the estimates of 4.3% but remained higher than the former release of 3.8%.
USD/JPY has added significant gains after delivering a breakout of the Ascending Triangle chart pattern formed on the daily scale. The asset is aggressively marching towards the horizontal resistance plotted from 11 November 2022 high at 142.25.
The Relative Strength Index (RSI) (14) is oscillating in the bullish range of 60.00-80.00, which indicates that the upside momentum is active.
Technical Levels: Supports and Resistances
USDJPY currently trading at 139.84 at the time of writing. Pair opened at 140.07 and is trading with a change of -0.16 % .
| Overview | Overview.1 | |
|---|---|---|
| 0 | Today last price | 139.84 |
| 1 | Today Daily Change | -0.23 |
| 2 | Today Daily Change % | -0.16 |
| 3 | Today daily open | 140.07 |
The pair remains strongly bullish on the daily timeframe. It trades above its 20 SMA @ 136.62, 50 SMA 134.31, 100 SMA @ 133.43 and 200 SMA @ 137.21.
| Trends | Trends.1 | |
|---|---|---|
| 0 | Daily SMA20 | 136.62 |
| 1 | Daily SMA50 | 134.31 |
| 2 | Daily SMA100 | 133.43 |
| 3 | Daily SMA200 | 137.21 |
The previous day high was 140.23 while the previous day low was 138.82. The daily 38.2% Fib levels comes at 139.69, expected to provide support. Similarly, the daily 61.8% fib level is at 139.36, expected to provide support.
Note the levels of interest below:
- Pivot support is noted at 139.18, 138.3, 137.77
- Pivot resistance is noted at 140.59, 141.12, 142.0
| Levels | Levels.1 |
|---|---|
| Previous Daily High | 140.23 |
| Previous Daily Low | 138.82 |
| Previous Weekly High | 138.75 |
| Previous Weekly Low | 135.65 |
| Previous Monthly High | 136.56 |
| Previous Monthly Low | 130.63 |
| Daily Fibonacci 38.2% | 139.69 |
| Daily Fibonacci 61.8% | 139.36 |
| Daily Pivot Point S1 | 139.18 |
| Daily Pivot Point S2 | 138.30 |
| Daily Pivot Point S3 | 137.77 |
| Daily Pivot Point R1 | 140.59 |
| Daily Pivot Point R2 | 141.12 |
| Daily Pivot Point R3 | 142.00 |
[/s2If]
Nehcap Expert Advisor
The NEHCAP MT4 EA is high quality professional trading system geared to generate returns without using GRID or martingales. Each trade has strict risk per trade parameter. The pairs under management include EURUSD, GBPUSD, AUDCAD, AUDNZD,GBPAUD, EURAUD, EURCAD, CHFJPY and many more.
The system is trading live: LIVE ACCOUNT TRACKING
You can run it free. Apply for a free trial and track our account. Buy the system or use profit share mechanism to generate returns on your MT4.
Join Our Telegram Group
")


