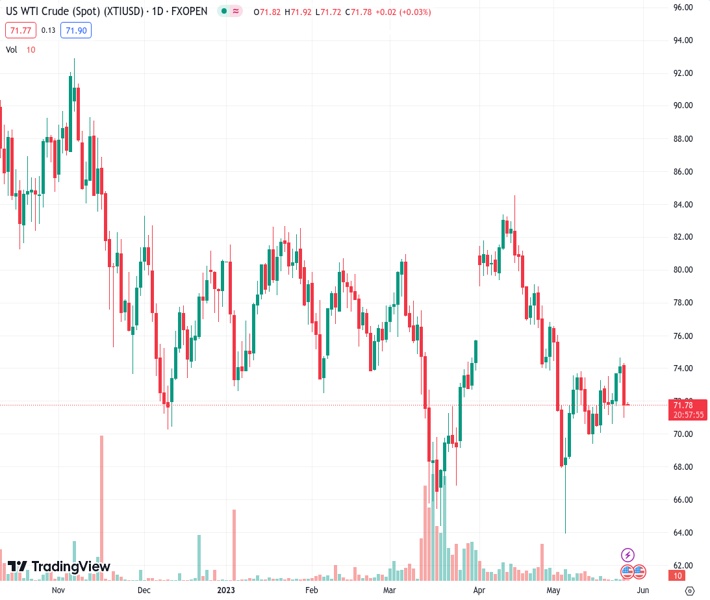
The oil price has faced selling interest after a recovery move to near $72.00 (Pivot Orderbook analysis)
…
This is a premium post.
[s2If !current_user_can(access_s2member_level4)]Please register for FREE REGISTER to read full post below containing analysis. In case of any error or you think you are not able to read the full post below, please email us at support#nehcap.com [lwa][/s2If] [s2If current_user_can(access_s2member_level1)]
- The oil price has faced selling interest after a recovery move to near $72.00
- as OPEC is not expected to cut its overall output ahead.
- Continuous negotiations over US debt-ceiling issues indicate that a bipartisan will be there before the US Treasury meeting default.
- The oil price is at a make or a break level near the upward-sloping trendline plotted from May 04 low at $67.47.s
The pair currently trades last at 71.82.
The previous day high was 74.7 while the previous day low was 73.12. The daily 38.2% Fib levels comes at 74.1, expected to provide resistance. Similarly, the daily 61.8% fib level is at 73.73, expected to provide resistance.
West Texas Intermediate (WTI), futures on NYMEX, have faced tough barricades after a recovery attempt to near $72.00 in the early Asian session. The oil price is anticipated to resume its downside journey further as OPEC is not expected to cut its overall output further in its next meeting on June 04.
Russian Deputy Prime Minister Alexander Novak said he expected no new steps from OPEC+ at its meeting on June 4. Contrary to that, Saudi Energy Minister Abdulaziz bin Salman had hinted at the possibility of another round of production cuts at the meeting.
The US Dollar Index (DXY) has corrected to near 104.21 as continuous negotiations between the White House and Republican leaders are indicating that a bipartisan will be there before the US Treasury meeting deadline of default.
A responsive selling action dragged the oil price sharply after it failed to sustain above the 50% Fibonacci retracement (plotted from April 12 high at $83.40 to May 03 low at $64.31) at $73.94 on a four-hour scale. Also, the 200-period Exponential Moving Average (EMA) at $73.72 acted as a barrier for the oil bulls.
The oil price is at a make or a break level near the upward-sloping trendline plotted from May 04 low at $67.47.
A slippage into the bearish range of 20.00-40.00 by the Relative Strength Index (RSI) (14) will trigger the downside momentum.
Going forward, a downside move below May 25 low at $71.03 will weigh heavily on the oil price and will drag it toward the crucial support at $70.00 followed by the 23.6% Fibo retracement at $68.88.
In an alternate scenario, a solid recovery above the 50% Fibo retracement at $73.94 will drive the asset toward a 61.8% Fibo retracement at $$76.16. Further recovery above the latter would expose the oil price to April 26 high at $77.86.
Technical Levels: Supports and Resistances
XTIUSD currently trading at 71.82 at the time of writing. Pair opened at 74.21 and is trading with a change of -3.22 % .
| Overview | Overview.1 | |
|---|---|---|
| 0 | Today last price | 71.82 |
| 1 | Today Daily Change | -2.39 |
| 2 | Today Daily Change % | -3.22 |
| 3 | Today daily open | 74.21 |
The pair remains strongly bearish on the daily time frame. It trades below the 20 SMA @ 72.27, 50 SMA 74.44, 100 SMA @ 76.02 and 200 SMA @ 79.78.
| Trends | Trends.1 | |
|---|---|---|
| 0 | Daily SMA20 | 72.27 |
| 1 | Daily SMA50 | 74.44 |
| 2 | Daily SMA100 | 76.02 |
| 3 | Daily SMA200 | 79.78 |
The previous day high was 74.7 while the previous day low was 73.12. The daily 38.2% Fib levels comes at 74.1, expected to provide resistance. Similarly, the daily 61.8% fib level is at 73.73, expected to provide resistance.
Note the levels of interest below:
- Pivot support is noted at 73.32, 72.43, 71.74
- Pivot resistance is noted at 74.9, 75.59, 76.48
| Levels | Levels.1 |
|---|---|
| Previous Daily High | 74.70 |
| Previous Daily Low | 73.12 |
| Previous Weekly High | 73.55 |
| Previous Weekly Low | 69.39 |
| Previous Monthly High | 83.40 |
| Previous Monthly Low | 73.88 |
| Daily Fibonacci 38.2% | 74.10 |
| Daily Fibonacci 61.8% | 73.73 |
| Daily Pivot Point S1 | 73.32 |
| Daily Pivot Point S2 | 72.43 |
| Daily Pivot Point S3 | 71.74 |
| Daily Pivot Point R1 | 74.90 |
| Daily Pivot Point R2 | 75.59 |
| Daily Pivot Point R3 | 76.48 |
[/s2If]
Nehcap Expert Advisor
The NEHCAP MT4 EA is high quality professional trading system geared to generate returns without using GRID or martingales. Each trade has strict risk per trade parameter. The pairs under management include EURUSD, GBPUSD, AUDCAD, AUDNZD,GBPAUD, EURAUD, EURCAD, CHFJPY and many more.
The system is trading live: LIVE ACCOUNT TRACKING
You can run it free. Apply for a free trial and track our account. Buy the system or use profit share mechanism to generate returns on your MT4.
Join Our Telegram Group


