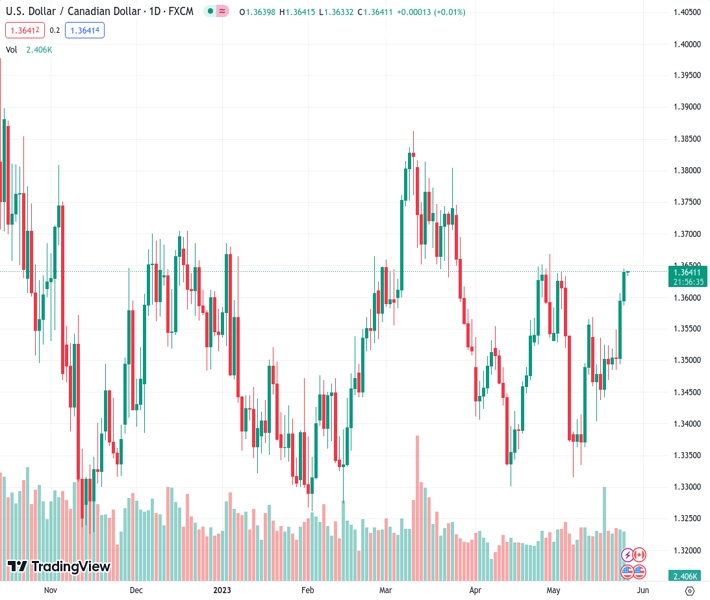
#USDCAD @ 1.36370 is eyeing a break above the immediate resistance of 1.3640 amid broader strength in the US Dollar. (Pivot Orderbook analysis)
…
This is a premium post.
[s2If !current_user_can(access_s2member_level4)]Please register for FREE REGISTER to read full post below containing analysis. In case of any error or you think you are not able to read the full post below, please email us at support#nehcap.com [lwa][/s2If] [s2If current_user_can(access_s2member_level1)]
- USD/CAD is eyeing a break above the immediate resistance of 1.3640 amid broader strength in the US Dollar.
- Oil prices tumbled after Russian Novak said he expected no new steps from OPEC+ at its meeting on June 4.
- The US Dollar bulls have got strength after climbing above the downward-sloping trendline plotted from 1.3862.
The pair currently trades last at 1.36370.
The previous day high was 1.3606 while the previous day low was 1.3496. The daily 38.2% Fib levels comes at 1.3564, expected to provide support. Similarly, the daily 61.8% fib level is at 1.3538, expected to provide support.
The USD/CAD pair is gathering strength for a break above the immediate resistance of 1.3640 in the early Asian session. The Loonie asset remained in bullish territory amid strength in the US Dollar Index (DXY) and a weakness in the oil price.
Oil prices tumbled after Russian Deputy Prime Minister Alexander Novak said he expected no new steps from OPEC+ at its meeting on June 4. At the press time, the oil price has shown some recovery, however, the downside bias is still solid. It is worth noting that Canada is the leading exporter of oil to the United States and lower oil prices impact the Canadian Dollar significantly.
The US Dollar Index (DXY) has corrected marginally after a solid upside after the White House Communications Director said we are getting closer to a deal on the debt ceiling. Going forward, US Durable Goods orders data (April) will remain in the spotlight.
USD/CAD has shown a stellar upside action after a breakout of the Symmetrical Triangle formed on a four-hour scale. The US Dollar bulls have got strength after climbing above the downward-sloping trendline plotted from March 10 high at 1.3862. The Loonie asset is approaching the previous month’s high at 1.3668.
A range shift move by the Relative Strength Index (RSI) (14) into the 60.00-80.00 territory from the 40.00-60.00 zone indicates that the upside momentum has been triggered.
Investors should wait for a marginal correction to near the immediate support of 1.3610 for a fresh buy, which will deliver gains till the previous month’s high at 1.3668 followed by the round-level resistance at 1.3700.
On the flip side, a break below May 23 high at 1.3550 will drag the asset toward the psychological support at 1.3500. A breakdown below the latter will expose the Loonie asset to April 20 low at 1.3448.
Technical Levels: Supports and Resistances
USDCAD currently trading at 1.3641 at the time of writing. Pair opened at 1.3595 and is trading with a change of 0.34 % .
| Overview | Overview.1 | |
|---|---|---|
| 0 | Today last price | 1.3641 |
| 1 | Today Daily Change | 0.0046 |
| 2 | Today Daily Change % | 0.3400 |
| 3 | Today daily open | 1.3595 |
The pair remains strongly bullish on the daily timeframe. It trades above its 20 SMA @ 1.3502, 50 SMA 1.3529, 100 SMA @ 1.3509 and 200 SMA @ 1.3487.
| Trends | Trends.1 | |
|---|---|---|
| 0 | Daily SMA20 | 1.3502 |
| 1 | Daily SMA50 | 1.3529 |
| 2 | Daily SMA100 | 1.3509 |
| 3 | Daily SMA200 | 1.3487 |
The previous day high was 1.3606 while the previous day low was 1.3496. The daily 38.2% Fib levels comes at 1.3564, expected to provide support. Similarly, the daily 61.8% fib level is at 1.3538, expected to provide support.
Note the levels of interest below:
- Pivot support is noted at 1.3525, 1.3456, 1.3415
- Pivot resistance is noted at 1.3635, 1.3675, 1.3745
| Levels | Levels.1 |
|---|---|
| Previous Daily High | 1.3606 |
| Previous Daily Low | 1.3496 |
| Previous Weekly High | 1.3568 |
| Previous Weekly Low | 1.3404 |
| Previous Monthly High | 1.3668 |
| Previous Monthly Low | 1.3301 |
| Daily Fibonacci 38.2% | 1.3564 |
| Daily Fibonacci 61.8% | 1.3538 |
| Daily Pivot Point S1 | 1.3525 |
| Daily Pivot Point S2 | 1.3456 |
| Daily Pivot Point S3 | 1.3415 |
| Daily Pivot Point R1 | 1.3635 |
| Daily Pivot Point R2 | 1.3675 |
| Daily Pivot Point R3 | 1.3745 |
[/s2If]
Nehcap Expert Advisor
The NEHCAP MT4 EA is high quality professional trading system geared to generate returns without using GRID or martingales. Each trade has strict risk per trade parameter. The pairs under management include EURUSD, GBPUSD, AUDCAD, AUDNZD,GBPAUD, EURAUD, EURCAD, CHFJPY and many more.
The system is trading live: LIVE ACCOUNT TRACKING
You can run it free. Apply for a free trial and track our account. Buy the system or use profit share mechanism to generate returns on your MT4.
Join Our Telegram Group


