#NZDUSD @ 0.60620 prods yearly low near 0.6050 as RBNZ confirms easy LVR restrictions, US data eyed (Pivot Orderbook analysis)
…
This is a premium post.
[s2If !current_user_can(access_s2member_level4)]Please register for FREE REGISTER to read full post below containing analysis. In case of any error or you think you are not able to read the full post below, please email us at support#nehcap.com [lwa][/s2If] [s2If current_user_can(access_s2member_level1)]
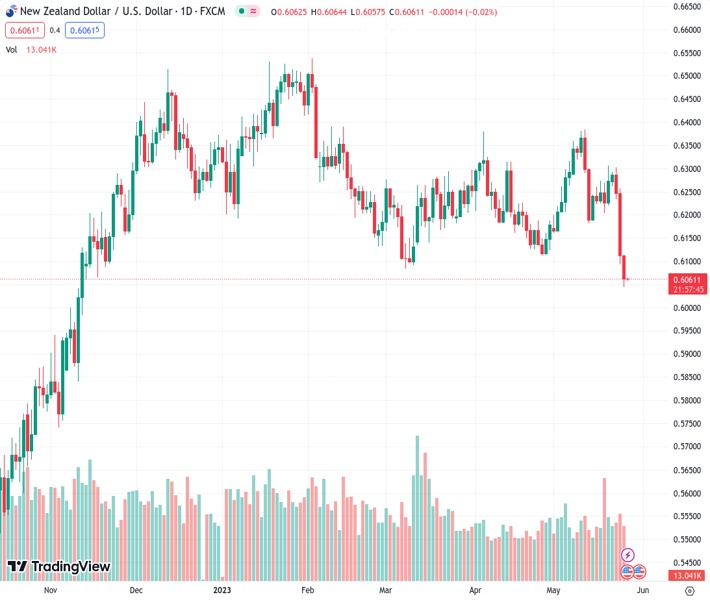
The pair currently trades last at 0.60620.
The previous day high was 0.6262 while the previous day low was 0.6093. The daily 38.2% Fib levels comes at 0.6157, expected to provide resistance. Similarly, the daily 61.8% fib level is at 0.6197, expected to provide resistance.
NZD/USD licks its wounds at the lowest levels since November as the Reserve Bank of New Zealand (RBNZ) announces the easing of lending restrictions on early Friday. Also exerting downside pressure on the Kiwi pair is the broadly firmer US Dollar and flat New Zealand Consumer Confidence. That said, the quote seesaws around 0.6060 by the press time after falling in the last three consecutive days to refresh the Year-To-Date (YTD) low.
“The risks to financial stability posed by high-LVR lending have reduced to a level where we believe the current restrictions may be unnecessarily reducing efficiency,” said RBNZ Deputy Governor Christian Hawkesby while announcing the easing on the Loan-to-Value Restrictions (LVR).
On the other hand, New Zealand’s Consumer Confidence gauge slightly fell to 79.2 in May from April’s 79.3, per the ANZ-Roy Morgan survey for May. “While the labor market remains tight, conferring both a high degree of job security and strong wage growth, the ongoing cost of living increases, including higher mortgage rates for the 38% of households who have a mortgage, continue to bite,” ANZ Chief Economist Sharon Zollner said in a statement, reported Reuters.
Elsewhere, the second estimation of the US Annualized Gross Domestic Product (GDP) for Q1 2023 was revised up to 1.3% versus 1.0% first forecasts. Further, the Chicago Fed National Activity Index for April improved to 0.07 from -0.37 prior and -0.02 market estimations. On the same line, Kansad Fed Manufacturing Activity improved to -2 for May compared to -21 previous readings and analysts’ estimations of -11. It’s worth noting that the US Pending Home Sales for April improved on YoY but eased on MoM whereas Core Personal Consumption Expenditures also rose to 5.0% during the preliminary readings versus 4.9% prior.
Apart from the upbeat US data, looming fears of the US default also allow the US Dollar to dominate. Recently, US House Speaker Kevin McCarthy announced no agreement on the debt deal, as well as the continuation of talks by saying, “It’s hard. But we’re working and we’re going to continue to work until we get this done.”
Amid these plays, the US Dollar Index (DXY) rose to the highest levels in 10 weeks, to 104.20 at the latest, whereas the US 10-year and two-year Treasury bond yields rose to the early March highs of around 3.82% and 4.54% in that order. That said, Wall Street closed mixed but S&P500 Futures is mildly offered at the latest.
Moving on, multiple US data stand tall to direct the NZD/USD moves, apart from the US debt ceiling negotiations. Among them, the US Durable Goods Orders for April and the Core Personal Consumption Expenditure (PCE) Price Index for the said month, known as the Fed’s preferred inflation gauge, will be crucial to watch.
A daily closing below an upward-sloping support line from mid-November, now immediate resistance around 0.6100, keeps the NZD/USD bears hopeful.
Technical Levels: Supports and Resistances
NZDUSD currently trading at 0.6063 at the time of writing. Pair opened at 0.6113 and is trading with a change of -0.82% % .
| Overview | Overview.1 | |
|---|---|---|
| 0 | Today last price | 0.6063 |
| 1 | Today Daily Change | -0.0050 |
| 2 | Today Daily Change % | -0.82% |
| 3 | Today daily open | 0.6113 |
The pair remains strongly bearish on the daily time frame. It trades below the 20 SMA @ 0.6237, 50 SMA 0.6228, 100 SMA @ 0.6272 and 200 SMA @ 0.6155.
| Trends | Trends.1 | |
|---|---|---|
| 0 | Daily SMA20 | 0.6237 |
| 1 | Daily SMA50 | 0.6228 |
| 2 | Daily SMA100 | 0.6272 |
| 3 | Daily SMA200 | 0.6155 |
The previous day high was 0.6262 while the previous day low was 0.6093. The daily 38.2% Fib levels comes at 0.6157, expected to provide resistance. Similarly, the daily 61.8% fib level is at 0.6197, expected to provide resistance.
Note the levels of interest below:
- Pivot support is noted at 0.605, 0.5987, 0.5882
- Pivot resistance is noted at 0.6219, 0.6324, 0.6387
| Levels | Levels.1 |
|---|---|
| Previous Daily High | 0.6262 |
| Previous Daily Low | 0.6093 |
| Previous Weekly High | 0.6306 |
| Previous Weekly Low | 0.6117 |
| Previous Monthly High | 0.6389 |
| Previous Monthly Low | 0.6111 |
| Daily Fibonacci 38.2% | 0.6157 |
| Daily Fibonacci 61.8% | 0.6197 |
| Daily Pivot Point S1 | 0.6050 |
| Daily Pivot Point S2 | 0.5987 |
| Daily Pivot Point S3 | 0.5882 |
| Daily Pivot Point R1 | 0.6219 |
| Daily Pivot Point R2 | 0.6324 |
| Daily Pivot Point R3 | 0.6387 |
[/s2If]
Nehcap Expert Advisor
The NEHCAP MT4 EA is high quality professional trading system geared to generate returns without using GRID or martingales. Each trade has strict risk per trade parameter. The pairs under management include EURUSD, GBPUSD, AUDCAD, AUDNZD,GBPAUD, EURAUD, EURCAD, CHFJPY and many more.
The system is trading live: LIVE ACCOUNT TRACKING
You can run it free. Apply for a free trial and track our account. Buy the system or use profit share mechanism to generate returns on your MT4.
Join Our Telegram Group


