#EURUSD @ 1.07248 dips to 1.0707 amidst soaring US Treasury bond yields, but mixed market sentiment prevents a steeper fall. (Pivot Orderbook analysis)
…
This is a premium post.
[s2If !current_user_can(access_s2member_level4)]Please register for FREE REGISTER to read full post below containing analysis. In case of any error or you think you are not able to read the full post below, please email us at support#nehcap.com [lwa][/s2If] [s2If current_user_can(access_s2member_level1)]
- EUR/USD dips to 1.0707 amidst soaring US Treasury bond yields, but mixed market sentiment prevents a steeper fall.
- The pair could witness further losses if sellers successfully reclaim the 1.0700 mark, shifting the bias downward.
- Staying above 1.0700 could lead to a EUR/USD comeback, with 1.0900 in sight if key resistance levels are broken.
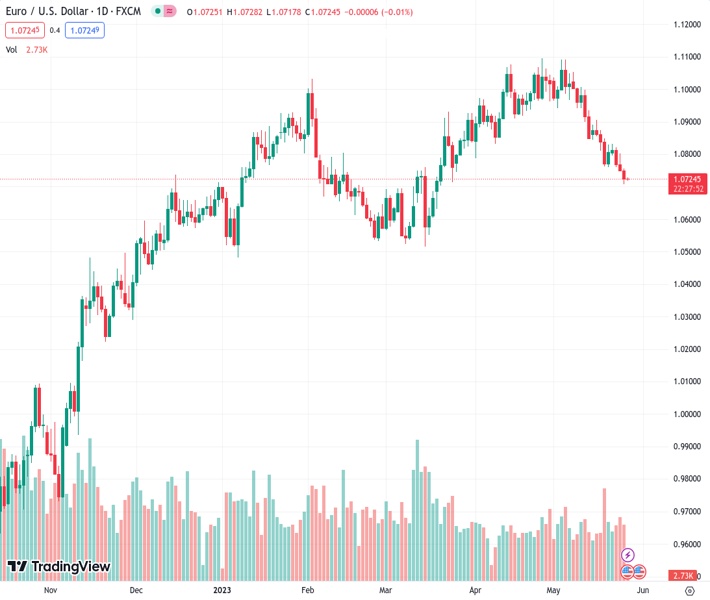
The pair currently trades last at 1.07248.
The previous day high was 1.0801 while the previous day low was 1.0748. The daily 38.2% Fib levels comes at 1.0769, expected to provide resistance. Similarly, the daily 61.8% fib level is at 1.0781, expected to provide resistance.
EUR/USD hit a new two-month low at around 1.0707, though it remains neutral to downward biased unless the pair suffers more weakness, which could send the EUR/USD sinking below the 1.0700 mark toward the 200-day Exponential Moving Average (EMA) at 1.0684. Nevertheless, a mixed market sentiment capped the Euro{s (EUR) fall, even though US Treasury bond yields skyrocketed, underpinning the US Dollar (USD). As the Asian session begins, the EUR/USD trades at 1.0727, up 0.02%.
Two days ago, the EUR/USD slumped below the 100-day Exponential Moving Average (EMA) at 1.0776, with sellers taking advantage of it, as the EUR/USD registered three straight sessions of losses. Although the pair will likely print additional losses, sellers must reclaim the 1.0700. That would leave the pair exposed, and once the EUR/USD dives below the 200-day EMA, that would shift the pair bias downwards.
That said, the EUR/USD first support would be the 2020 yearly low of 1.0636, ahead of falling to 1.0600. Break below will expose the March 15 daily low of 1.0516 before dropping to the year-to-date (YTD) low of 1.0482.
Conversely, if EUR/USD stays afloat above 1.0700, the EUR/USD could stage a comeback, initially to the 100-day EMA at 1.0776. A breach of the letter will expose 1.0800 before the EUR/USD threatens the confluence of technical indicators, like the 50 and 20-day EMAs, at around 1.0845-1.0857. Once the intersection gives way, 1.0900 is on the cards.
Technical Levels: Supports and Resistances
EURUSD currently trading at 1.0725 at the time of writing. Pair opened at 1.075 and is trading with a change of -0.23 % .
| Overview | Overview.1 | |
|---|---|---|
| 0 | Today last price | 1.0725 |
| 1 | Today Daily Change | -0.0025 |
| 2 | Today Daily Change % | -0.2300 |
| 3 | Today daily open | 1.0750 |
The pair is trading below its 20 Daily moving average @ 1.0916, below its 50 Daily moving average @ 1.09 , below its 100 Daily moving average @ 1.0813 and above its 200 Daily moving average @ 1.0476
| Trends | Trends.1 | |
|---|---|---|
| 0 | Daily SMA20 | 1.0916 |
| 1 | Daily SMA50 | 1.0900 |
| 2 | Daily SMA100 | 1.0813 |
| 3 | Daily SMA200 | 1.0476 |
The previous day high was 1.0801 while the previous day low was 1.0748. The daily 38.2% Fib levels comes at 1.0769, expected to provide resistance. Similarly, the daily 61.8% fib level is at 1.0781, expected to provide resistance.
Note the levels of interest below:
- Pivot support is noted at 1.0731, 1.0713, 1.0678
- Pivot resistance is noted at 1.0784, 1.0819, 1.0837
| Levels | Levels.1 |
|---|---|
| Previous Daily High | 1.0801 |
| Previous Daily Low | 1.0748 |
| Previous Weekly High | 1.0904 |
| Previous Weekly Low | 1.0760 |
| Previous Monthly High | 1.1095 |
| Previous Monthly Low | 1.0788 |
| Daily Fibonacci 38.2% | 1.0769 |
| Daily Fibonacci 61.8% | 1.0781 |
| Daily Pivot Point S1 | 1.0731 |
| Daily Pivot Point S2 | 1.0713 |
| Daily Pivot Point S3 | 1.0678 |
| Daily Pivot Point R1 | 1.0784 |
| Daily Pivot Point R2 | 1.0819 |
| Daily Pivot Point R3 | 1.0837 |
[/s2If]
Nehcap Expert Advisor
The NEHCAP MT4 EA is high quality professional trading system geared to generate returns without using GRID or martingales. Each trade has strict risk per trade parameter. The pairs under management include EURUSD, GBPUSD, AUDCAD, AUDNZD,GBPAUD, EURAUD, EURCAD, CHFJPY and many more.
The system is trading live: LIVE ACCOUNT TRACKING
You can run it free. Apply for a free trial and track our account. Buy the system or use profit share mechanism to generate returns on your MT4.
Join Our Telegram Group


