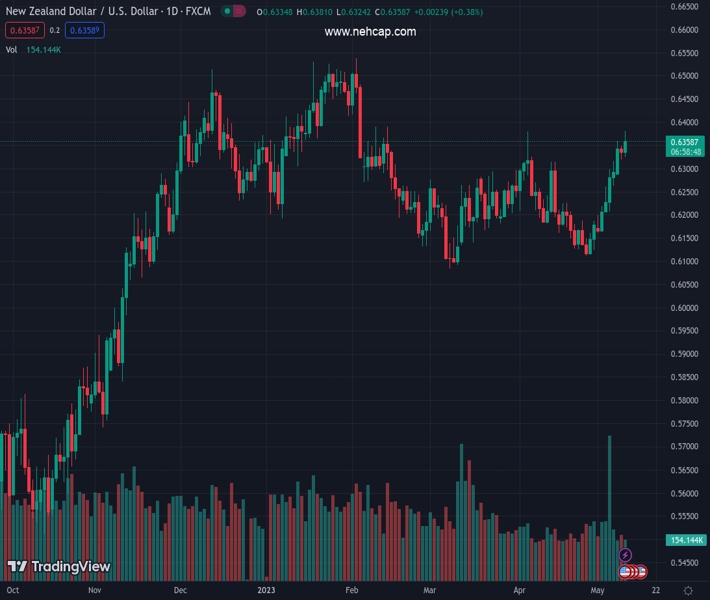
#NZDUSD @ 0.63559 gains strong positive traction on Wednesday and jumps to a nearly three-month top. (Pivot Orderbook analysis)
…
This is a premium post.
[s2If !current_user_can(access_s2member_level4)]Please register for FREE REGISTER to read full post below containing analysis. In case of any error or you think you are not able to read the full post below, please email us at support#nehcap.com [lwa][/s2If] [s2If current_user_can(access_s2member_level1)]
- NZD/USD gains strong positive traction on Wednesday and jumps to a nearly three-month top.
- The US CPI-inspired broad-based USD weakness turns out to be a key factor boosting the pair.
- A slightly overstretched RSI on hourly/daily charts is holding back bulls from placing fresh bets.
The pair currently trades last at 0.63559.
The previous day high was 0.635 while the previous day low was 0.6318. The daily 38.2% Fib levels comes at 0.633, expected to provide support. Similarly, the daily 61.8% fib level is at 0.6338, expected to provide support.
The NZD/USD pair catches fresh bids on Wednesday, following the previous day’s modest downtick, and resumes its recent upward trajectory witnessed over the past two weeks or so. The momentum picks up pace following the release of the latest US consumer inflation figures and lifts spot prices to a nearly three-month high, around the 0.6380 region during the early North American session.
The US Dollar (USD) weakens across the board after the US Bureau of Labor Statistics reported that inflation in the US, as measured by the Consumer Price Index (CPI) rose 0.4% in April and the yearly rate eased to 4.9% from 5%. Meanwhile, the Core CPI, which excludes volatile food and energy prices, came in at 0.4% and 5.5% on monthly and yearly basis, respectively. In the absence of any upside surprise, the data reaffirms expectations for an imminent pause in the Federal Reserve’s (Fed) year-long rate-hiking cycle, which, in turn, weighs heavily on the buck and provides a strong boost to the NZD/USD pair.
The markets, meanwhile, have also started pricing in the possibility that the US central bank will start cutting interest rates later this year, which, along with concerns about the US debt ceiling, leads to a fresh leg down in the US Treasury bond yields. It is worth recalling that US President Joe Biden and House of Representatives Speaker Kevin McCarthy remained divided over raising the $31.4 trillion US debt limit, though agreed to continue talks aimed at breaking the deadlock. Apart from this, a positive risk tone is seen undermining the safe-haven Greenback and benefitting the risk-sensitive Kiwi.
The New Zealand Dollar (NZD) draws additional support from expectations for further rate hikes by the Reserve Bank of New Zealand (RBNZ). This, in turn, suggests that the path of least resistance for the NZD/USD pair is to the upside. That said, the Relative Strength Index (RSI) on hourly and daily charts has moved on the verge of breaking into the overbought territory. This, in turn, prompts some profit-taking and leads to a modest pullback of around 30 pips in the last hour. Nevertheless, the aforementioned supportive fundamental backdrop should limit any meaningful corrective decline.
Technical Levels: Supports and Resistances
NZDUSD currently trading at 0.6369 at the time of writing. Pair opened at 0.6335 and is trading with a change of 0.54 % .
| Overview | Overview.1 | |
|---|---|---|
| 0 | Today last price | 0.6369 |
| 1 | Today Daily Change | 0.0034 |
| 2 | Today Daily Change % | 0.5400 |
| 3 | Today daily open | 0.6335 |
The pair remains strongly bullish on the daily timeframe. It trades above its 20 SMA @ 0.621, 50 SMA 0.6217, 100 SMA @ 0.6279 and 200 SMA @ 0.616.
| Trends | Trends.1 | |
|---|---|---|
| 0 | Daily SMA20 | 0.6210 |
| 1 | Daily SMA50 | 0.6217 |
| 2 | Daily SMA100 | 0.6279 |
| 3 | Daily SMA200 | 0.6160 |
The previous day high was 0.635 while the previous day low was 0.6318. The daily 38.2% Fib levels comes at 0.633, expected to provide support. Similarly, the daily 61.8% fib level is at 0.6338, expected to provide support.
Note the levels of interest below:
- Pivot support is noted at 0.6318, 0.6302, 0.6286
- Pivot resistance is noted at 0.6351, 0.6367, 0.6383
| Levels | Levels.1 |
|---|---|
| Previous Daily High | 0.6350 |
| Previous Daily Low | 0.6318 |
| Previous Weekly High | 0.6316 |
| Previous Weekly Low | 0.6160 |
| Previous Monthly High | 0.6389 |
| Previous Monthly Low | 0.6111 |
| Daily Fibonacci 38.2% | 0.6330 |
| Daily Fibonacci 61.8% | 0.6338 |
| Daily Pivot Point S1 | 0.6318 |
| Daily Pivot Point S2 | 0.6302 |
| Daily Pivot Point S3 | 0.6286 |
| Daily Pivot Point R1 | 0.6351 |
| Daily Pivot Point R2 | 0.6367 |
| Daily Pivot Point R3 | 0.6383 |
[/s2If]
Nehcap Expert Advisor
The NEHCAP MT4 EA is high quality professional trading system geared to generate returns without using GRID or martingales. Each trade has strict risk per trade parameter. The pairs under management include EURUSD, GBPUSD, AUDCAD, AUDNZD,GBPAUD, EURAUD, EURCAD, CHFJPY and many more.
The system is trading live: LIVE ACCOUNT TRACKING
You can run it free. Apply for a free trial and track our account. Buy the system or use profit share mechanism to generate returns on your MT4.
Join Our Telegram Group
")


