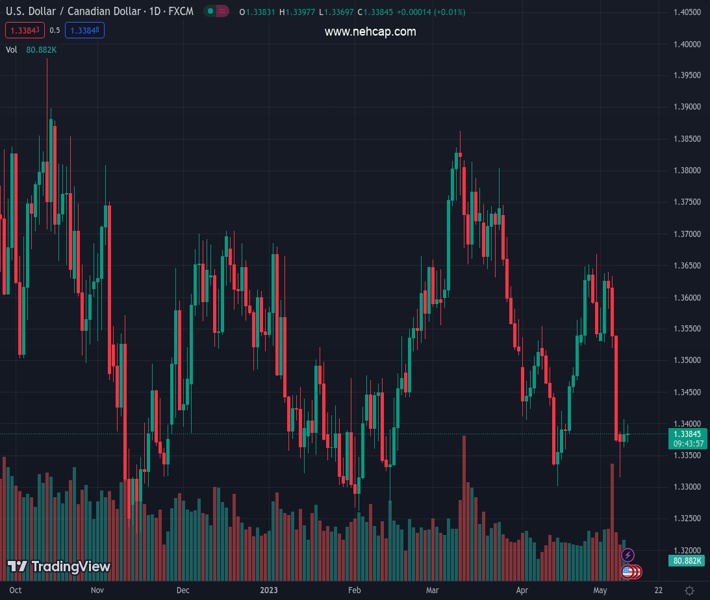
#USDCAD @ 1.33873 attracts some buyers for the second straight day, albeit lacks bullish conviction. (Pivot Orderbook analysis)
…
This is a premium post.
[s2If !current_user_can(access_s2member_level4)]Please register for FREE REGISTER to read full post below containing analysis. In case of any error or you think you are not able to read the full post below, please email us at support#nehcap.com [lwa][/s2If] [s2If current_user_can(access_s2member_level1)]
- USD/CAD attracts some buyers for the second straight day, albeit lacks bullish conviction.
- Retreating Oil prices undermines the Loonie and lends support amid a modest USD uptick.
- The Fed’s less hawkish outlook seems to cap the USD ahead of the crucial US CPI report.
The pair currently trades last at 1.33873.
The previous day high was 1.3406 while the previous day low was 1.3365. The daily 38.2% Fib levels comes at 1.3391, expected to provide resistance. Similarly, the daily 61.8% fib level is at 1.3381, expected to provide support.
The USD/CAD pair edges higher for the second straight day on Wednesday, albeit struggles to capitalize on the move and remains below the 1.3400 mark through the mid-European session.
Crude Oil prices come under some selling pressure and stall a four-day recovery from a 17-month low touched last week. This, in turn, is seen undermining the commodity-linked Loonie, which, along with a modest US Dollar (USD) strength, acts as a tailwind for the USD/CAD pair. The recent rise in the US Treasury bond yields, bolstered by easing fears of a full-blown banking crisis in the US, turns out to be a key factor lending some support to the Greenback. Apart from this, a generally weaker tone around the equity markets further seems to benefit the safe-haven buck.
That said, the uncertainty over the US debt limit, along with the Federal Reserve’s (Fed) less hawkish outlook, keeps a lid on the US bond yields and the USD. It is worth recalling that US President Joe Biden and House of Representatives Speaker Kevin McCarthy remained divided over raising the $31.4 trillion US debt limit, though agreed to further talks aimed at breaking the deadlock. The Fed, meanwhile, last week outlined a more stringent and data-driven approach to hiking rates further. Moreover, the markets have been pricing in the possibility of rate cuts later this year.
This, in turn, is holding back the USD bulls from placing aggressive bets and capping gains for the USD/CAD pair as traders keenly await the release of the latest US consumer inflation figures during the early North American session. The crucial US CPI report will influence expectations about the Fed’s next policy move, which, in turn, should drive the USD demand. Apart from this, Oil price dynamics should provide some impetus to the USD/CAD pair and further contribute to producing short-term trading opportunities.
Technical Levels: Supports and Resistances
USDCAD currently trading at 1.3387 at the time of writing. Pair opened at 1.3384 and is trading with a change of 0.02 % .
| Overview | Overview.1 | |
|---|---|---|
| 0 | Today last price | 1.3387 |
| 1 | Today Daily Change | 0.0003 |
| 2 | Today Daily Change % | 0.0200 |
| 3 | Today daily open | 1.3384 |
The pair remains strongly bearish on the daily time frame. It trades below the 20 SMA @ 1.3491, 50 SMA 1.3576, 100 SMA @ 1.3518 and 200 SMA @ 1.3452.
| Trends | Trends.1 | |
|---|---|---|
| 0 | Daily SMA20 | 1.3491 |
| 1 | Daily SMA50 | 1.3576 |
| 2 | Daily SMA100 | 1.3518 |
| 3 | Daily SMA200 | 1.3452 |
The previous day high was 1.3406 while the previous day low was 1.3365. The daily 38.2% Fib levels comes at 1.3391, expected to provide resistance. Similarly, the daily 61.8% fib level is at 1.3381, expected to provide support.
Note the levels of interest below:
- Pivot support is noted at 1.3364, 1.3344, 1.3323
- Pivot resistance is noted at 1.3405, 1.3426, 1.3446
| Levels | Levels.1 |
|---|---|
| Previous Daily High | 1.3406 |
| Previous Daily Low | 1.3365 |
| Previous Weekly High | 1.3639 |
| Previous Weekly Low | 1.3371 |
| Previous Monthly High | 1.3668 |
| Previous Monthly Low | 1.3301 |
| Daily Fibonacci 38.2% | 1.3391 |
| Daily Fibonacci 61.8% | 1.3381 |
| Daily Pivot Point S1 | 1.3364 |
| Daily Pivot Point S2 | 1.3344 |
| Daily Pivot Point S3 | 1.3323 |
| Daily Pivot Point R1 | 1.3405 |
| Daily Pivot Point R2 | 1.3426 |
| Daily Pivot Point R3 | 1.3446 |
[/s2If]
Nehcap Expert Advisor
The NEHCAP MT4 EA is high quality professional trading system geared to generate returns without using GRID or martingales. Each trade has strict risk per trade parameter. The pairs under management include EURUSD, GBPUSD, AUDCAD, AUDNZD,GBPAUD, EURAUD, EURCAD, CHFJPY and many more.
The system is trading live: LIVE ACCOUNT TRACKING
You can run it free. Apply for a free trial and track our account. Buy the system or use profit share mechanism to generate returns on your MT4.
Join Our Telegram Group
")


