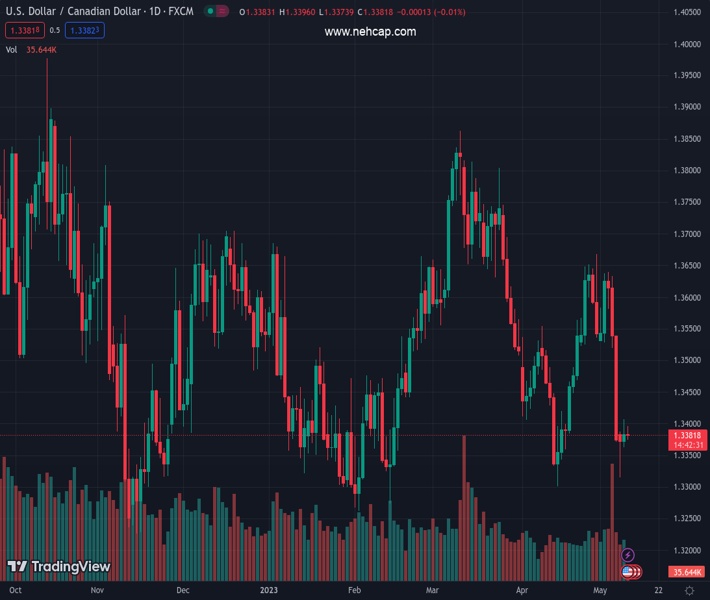
#USDCAD @ 1.33831 is aiming to recapture the round-level resistance of 1.3400 as oil corrects and the USD Index has rebounded. (Pivot Orderbook analysis)
…
This is a premium post.
[s2If !current_user_can(access_s2member_level4)]Please register for FREE REGISTER to read full post below containing analysis. In case of any error or you think you are not able to read the full post below, please email us at support#nehcap.com [lwa][/s2If] [s2If current_user_can(access_s2member_level1)]
- USD/CAD is aiming to recapture the round-level resistance of 1.3400 as oil corrects and the USD Index has rebounded.
- A bipartisan agreement is anticipated from US debt ceiling talks as a delay in the debt ceiling raise is not an option.
- An expression of consistently increasing inflation could compel the Federal Reserve to reconsider its neutral tone conveyed in the prior policy meeting.
- Oil prices are struggling to stretch recovery as investors are worried that persistence in the US inflation would deepen fears of recession.
The pair currently trades last at 1.33831.
The previous day high was 1.3406 while the previous day low was 1.3365. The daily 38.2% Fib levels comes at 1.3391, expected to provide resistance. Similarly, the daily 61.8% fib level is at 1.3381, expected to provide support.
USD/CAD is marching towards the round-level resistance of 1.3400 in the early European session. The Loonie asset has attracted significant bids after defending its crucial support of 1.3374. A decent recovery in the US Dollar Index (DXY) and a correction in the oil price have provided support to the Loonie asset.
S&P500 futures have trimmed some gains added in the Asian session as anxiety among investors ahead of the United States Consumer Price Index (CPI) data is soaring, portraying a risk-off market mood. US equities also faced selling pressure on Tuesday as investors were worried about the US debt ceiling crisis. While fears of a US debt ceiling crisis have been fueled further as negotiations between the White House and Republican leaders have adjourned till Friday.
The USD Index has rebounded firmly from the day’s low of 101.53. Investors are dodging US inflation-inspired uncertainty by diverging funds into the USD Index. Meanwhile, the yields offered on 10-year US government bonds are struggling for recovery. The 10-year US Treasury yields are trading below 3.52%.
White House officials and Republican leaders met late Tuesday for negotiations over US debt ceiling issues as a delay in the same is deepening fears of US Treasury default in addressing obligated payments. In the meeting, US President Joe Biden reiterated the requirement of raising the debt ceiling without compromising the spending budget. And US Biden is ready for a separate discussion about the budget.
On the other side, Republican House of Representatives Speaker Kevin McCarthy remained stuck to his intention of not approving debt ceiling raise without cutting the President’s spending initiatives to safeguard escalating budget deficit.
The street is anticipating a bipartisan agreement on Friday as US President Joe Biden made clear during the meeting that the US economy default is not an option.
As negotiations for the US debt ceiling raise have adjourned till Friday, investors have shifted their focus towards the US Inflation data. As per the preliminary report, monthly headline and core CPI figures are expected to jump by 0.4%. While annual headline inflation is seen steady at 5.0% and the core CPI that excludes volatile food and oil prices is seen softening mildly to 5.5% from the former release of 5.6%. An expression of consistently increasing inflation could compel the Federal Reserve (Fed) to reconsider its neutral tone conveyed in the previous monetary policy meeting.
Analysts at Goldman Sachs believe that softer United States CPI data is likely to be supportive of a rally in US stocks. They further added that CPI around or below the 5% consensus could spark an equity rally, with the S&P 500 rising at least 0.5%.” However, “A surprisingly strong reading would send stocks sharply lower, S&P 500 could drop at least 2% on a reading above 5.9%.”
West Texas Intermediate (WTI), futures on NYMEX, have corrected after failing to sustain above the critical resistance of $73.50. Oil prices are struggling to stretch recovery as investors are worried that an expression of persistence in US inflation would deepen fears of recession as the Federal Reserve will consider hiking interest rates further. Going forward, investors will keep an eye on the oil inventory data for the week ending May 05 to be released by US Energy Information Administration (EIA).
It is worth noting that Canada is the leading exporter of oil to the United States and a correction in the oil price is impacting the Canadian Dollar.
USD/CAD has shown a decent recovery after testing the demand zone placed in a narrow range of 1.3303-1.3315 on a four-hour scale. The Loonie asset is retracing toward the 20-period Exponential Moving Average (EMA), which is around 1.3410.
The Relative Strength Index (RSI) (14) is attempting a break into the 40.00-60.00 range from the bearish range of 20.00-40.00, which will trim downside bias for the Loonie asset.
Technical Levels: Supports and Resistances
USDCAD currently trading at 1.3389 at the time of writing. Pair opened at 1.3384 and is trading with a change of 0.04 % .
| Overview | Overview.1 | |
|---|---|---|
| 0 | Today last price | 1.3389 |
| 1 | Today Daily Change | 0.0005 |
| 2 | Today Daily Change % | 0.0400 |
| 3 | Today daily open | 1.3384 |
The pair remains strongly bearish on the daily time frame. It trades below the 20 SMA @ 1.3491, 50 SMA 1.3576, 100 SMA @ 1.3518 and 200 SMA @ 1.3452.
| Trends | Trends.1 | |
|---|---|---|
| 0 | Daily SMA20 | 1.3491 |
| 1 | Daily SMA50 | 1.3576 |
| 2 | Daily SMA100 | 1.3518 |
| 3 | Daily SMA200 | 1.3452 |
The previous day high was 1.3406 while the previous day low was 1.3365. The daily 38.2% Fib levels comes at 1.3391, expected to provide resistance. Similarly, the daily 61.8% fib level is at 1.3381, expected to provide support.
Note the levels of interest below:
- Pivot support is noted at 1.3364, 1.3344, 1.3323
- Pivot resistance is noted at 1.3405, 1.3426, 1.3446
| Levels | Levels.1 |
|---|---|
| Previous Daily High | 1.3406 |
| Previous Daily Low | 1.3365 |
| Previous Weekly High | 1.3639 |
| Previous Weekly Low | 1.3371 |
| Previous Monthly High | 1.3668 |
| Previous Monthly Low | 1.3301 |
| Daily Fibonacci 38.2% | 1.3391 |
| Daily Fibonacci 61.8% | 1.3381 |
| Daily Pivot Point S1 | 1.3364 |
| Daily Pivot Point S2 | 1.3344 |
| Daily Pivot Point S3 | 1.3323 |
| Daily Pivot Point R1 | 1.3405 |
| Daily Pivot Point R2 | 1.3426 |
| Daily Pivot Point R3 | 1.3446 |
[/s2If]
Nehcap Expert Advisor
The NEHCAP MT4 EA is high quality professional trading system geared to generate returns without using GRID or martingales. Each trade has strict risk per trade parameter. The pairs under management include EURUSD, GBPUSD, AUDCAD, AUDNZD,GBPAUD, EURAUD, EURCAD, CHFJPY and many more.
The system is trading live: LIVE ACCOUNT TRACKING
You can run it free. Apply for a free trial and track our account. Buy the system or use profit share mechanism to generate returns on your MT4.
Join Our Telegram Group
")


