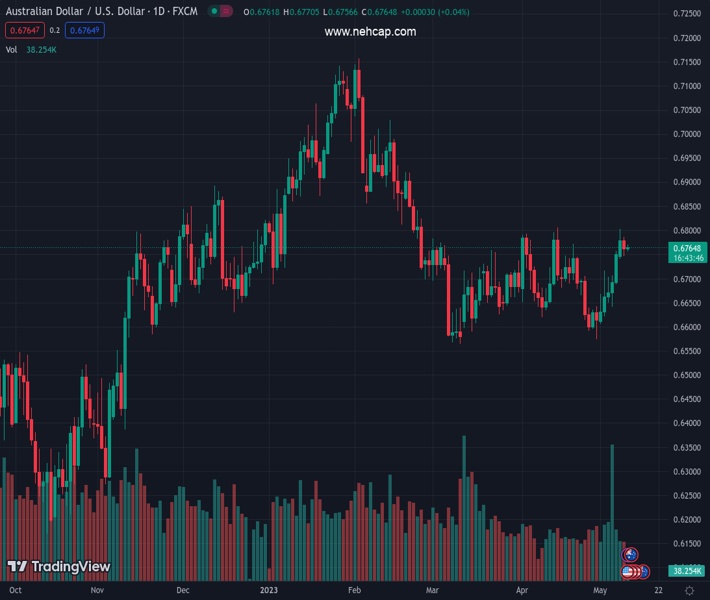
#AUDUSD @ 0.67654 pair has resumed its upside journey amid a correction in the US Dollar Index. (Pivot Orderbook analysis)
…
This is a premium post.
[s2If !current_user_can(access_s2member_level4)]Please register for FREE REGISTER to read full post below containing analysis. In case of any error or you think you are not able to read the full post below, please email us at support#nehcap.com [lwa][/s2If] [s2If current_user_can(access_s2member_level1)]
- AUD/USD pair has resumed its upside journey amid a correction in the US Dollar Index.
- The USD Index has refreshed its day’s low at 101.54 as a delay in US debt ceiling issues is impacting US long-term outlook.
- AUD/USD is oscillating in an accumulation phase in which inventory is shifted from retail participants to institutional investors.
The pair currently trades last at 0.67654.
The previous day high was 0.6787 while the previous day low was 0.6746. The daily 38.2% Fib levels comes at 0.6762, expected to provide support. Similarly, the daily 61.8% fib level is at 0.6771, expected to provide resistance.
The AUD/USD pair has resumed its upside journey after a corrective move to near 0.6750 in the Tokyo session. A solid recovery in the Aussie asset is being supported by a further correction in the US Dollar Index (DXY). The USD Index has refreshed its day’s low at 101.54 as a delay in US debt ceiling issues is impacting the long-term outlook of the United States economy.
Meanwhile, headlines that US Trade Chief Tai will meet Chinese commerce minister Wang Wentao in Detroit later in May is expected to keep the Australian Dollar active. Positive developments in the meeting would bring prosperity to their trade relations. It is worth noting that Australia is the leading trading partner of China and healthy trade relations in Sino-US will also improve opportunities for Australia.
AUD/USD is oscillating broadly in Wyckoff’s Accumulation phase in which inventory is shifted from retail participants to institutional investors. A breakout of the same results in wider bullish ticks and heavy volume.
The 10-period Exponential Moving Average (EMA) at 0.6721 is providing support to the Australian Dollar bulls.
Also, the Relative Strength Index (RSI) (14) is making efforts for climbing into the 60.00-80.00 range as it would trigger the upside momentum.
An acceptance above the round-level resistance at 0.6800 confidently, Australian Dollar bulls will firmly drive the asset higher toward February 06 low at 0.6855 followed by February 21 high at 0.6920.
In an alternate scenario, US Dollar bulls will flex their muscles if the Aussie asset will drop below March 15 low at 0.6590. An occurrence of the same will expose the asset to March 08 low at 0.6568 followed by 02 November 2022 high around 0.6500.
Technical Levels: Supports and Resistances
AUDUSD currently trading at 0.6768 at the time of writing. Pair opened at 0.6762 and is trading with a change of 0.09 % .
| Overview | Overview.1 | |
|---|---|---|
| 0 | Today last price | 0.6768 |
| 1 | Today Daily Change | 0.0006 |
| 2 | Today Daily Change % | 0.0900 |
| 3 | Today daily open | 0.6762 |
The pair is trading above its 20 Daily moving average @ 0.6693, above its 50 Daily moving average @ 0.6685 , below its 100 Daily moving average @ 0.679 and above its 200 Daily moving average @ 0.6727
| Trends | Trends.1 | |
|---|---|---|
| 0 | Daily SMA20 | 0.6693 |
| 1 | Daily SMA50 | 0.6685 |
| 2 | Daily SMA100 | 0.6790 |
| 3 | Daily SMA200 | 0.6727 |
The previous day high was 0.6787 while the previous day low was 0.6746. The daily 38.2% Fib levels comes at 0.6762, expected to provide support. Similarly, the daily 61.8% fib level is at 0.6771, expected to provide resistance.
Note the levels of interest below:
- Pivot support is noted at 0.6743, 0.6725, 0.6703
- Pivot resistance is noted at 0.6784, 0.6805, 0.6824
| Levels | Levels.1 |
|---|---|
| Previous Daily High | 0.6787 |
| Previous Daily Low | 0.6746 |
| Previous Weekly High | 0.6757 |
| Previous Weekly Low | 0.6607 |
| Previous Monthly High | 0.6806 |
| Previous Monthly Low | 0.6574 |
| Daily Fibonacci 38.2% | 0.6762 |
| Daily Fibonacci 61.8% | 0.6771 |
| Daily Pivot Point S1 | 0.6743 |
| Daily Pivot Point S2 | 0.6725 |
| Daily Pivot Point S3 | 0.6703 |
| Daily Pivot Point R1 | 0.6784 |
| Daily Pivot Point R2 | 0.6805 |
| Daily Pivot Point R3 | 0.6824 |
[/s2If]
Nehcap Expert Advisor
The NEHCAP MT4 EA is high quality professional trading system geared to generate returns without using GRID or martingales. Each trade has strict risk per trade parameter. The pairs under management include EURUSD, GBPUSD, AUDCAD, AUDNZD,GBPAUD, EURAUD, EURCAD, CHFJPY and many more.
The system is trading live: LIVE ACCOUNT TRACKING
You can run it free. Apply for a free trial and track our account. Buy the system or use profit share mechanism to generate returns on your MT4.
Join Our Telegram Group
")


