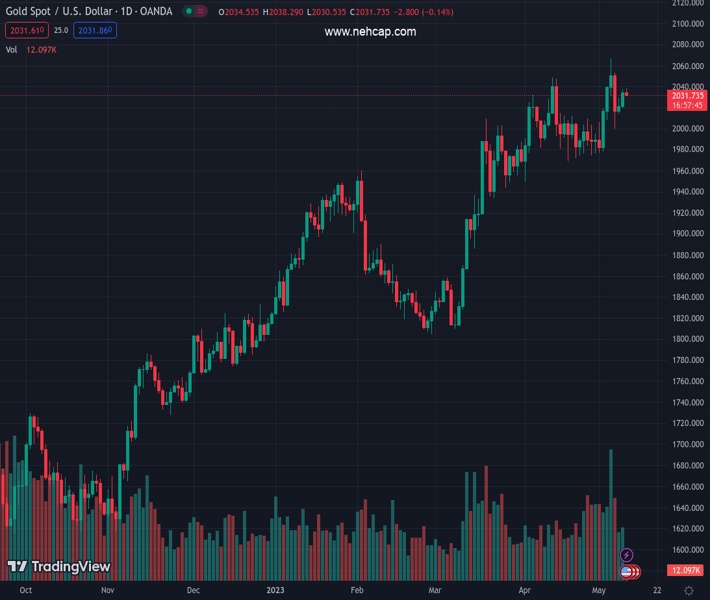
#XAUUSD @ 2,031.58 Gold price has slipped back to near $2,030.00 as investors have shifted their focus back to US inflation. (Pivot Orderbook analysis)
…
This is a premium post.
[s2If !current_user_can(access_s2member_level4)]Please register for FREE REGISTER to read full post below containing analysis. In case of any error or you think you are not able to read the full post below, please email us at support#nehcap.com [lwa][/s2If] [s2If current_user_can(access_s2member_level1)]
- Gold price has slipped back to near $2,030.00 as investors have shifted their focus back to US inflation.
- US CPI has regained the spotlight as US debt ceiling negotiations have adjourned till Friday.
- No raise in the debt ceiling is not an option as it would result in a default of obligated payments.
The pair currently trades last at 2031.58.
The previous day high was 2037.65 while the previous day low was 2019.62. The daily 38.2% Fib levels comes at 2030.76, expected to provide support. Similarly, the daily 61.8% fib level is at 2026.51, expected to provide support.
Gold price (XAU/USD) has sensed some pressure while attempting to surpass the immediate resistance of $2,040.00 in the Asian session. The precious metal is facing difficulties in attracting bids as investors are worried that an expression of persistence in the United States Consumer Price Index (CPI) will force the Federal Reserve (Fed) to return to a hawkish policy stance.
S&P500 futures are showing modest gains in Tokyo, portraying ease in the overall risk aversion theme. The US Dollar Index (DXY) has turned sideways around 101.55 as investors are shifting their focus toward the inflation data after knowing that US debt ceiling negotiations have adjourned till Friday.
Considering the current statements from US President Joe Biden and Speaker McCarthy, a bipartisan agreement is expected as the former wants to approve the debt-ceiling rate without sacrificing the scale of spending initiatives and the latter is not interested in approving the default. And, the important aspect is no raise in the debt ceiling is not an option as it would result in a default of obligated payments.
On the US economic data front, investors are anticipating that April’s monthly headline and core inflation accelerated by 0.4%. This could renew fears of a rebound in the inflationary pressures. It may create more troubles for the Fed as more rate hikes would push the economy into recession.
Gold price is facing barricades from the intermediate resistance plotted around $2,040.00. On a broader note, the pre4cious metal is auctioning in a Rising Channel chart pattern on a four-hour scale. The upper portion of the aforementioned chart pattern is placed from March 20 high at $2,009.88 while the lower portion is plotted from March 22 low at $1,934.34.
The 20-period Exponential Moving Average (EMA) at $2,027.58 might continue to perform as a cushion for the Gold bulls.
Meanwhile, the Relative Strength Index (RSI) (14) has sensed pressure while shifting into the bullish range of 60.00-80.00.
Technical Levels: Supports and Resistances
XAUUSD currently trading at 2030.89 at the time of writing. Pair opened at 2034.41 and is trading with a change of -0.17 % .
| Overview | Overview.1 | |
|---|---|---|
| 0 | Today last price | 2030.89 |
| 1 | Today Daily Change | -3.52 |
| 2 | Today Daily Change % | -0.17 |
| 3 | Today daily open | 2034.41 |
The pair remains strongly bullish on the daily timeframe. It trades above its 20 SMA @ 2007.82, 50 SMA 1961.31, 100 SMA @ 1913.63 and 200 SMA @ 1817.25.
| Trends | Trends.1 | |
|---|---|---|
| 0 | Daily SMA20 | 2007.82 |
| 1 | Daily SMA50 | 1961.31 |
| 2 | Daily SMA100 | 1913.63 |
| 3 | Daily SMA200 | 1817.25 |
The previous day high was 2037.65 while the previous day low was 2019.62. The daily 38.2% Fib levels comes at 2030.76, expected to provide support. Similarly, the daily 61.8% fib level is at 2026.51, expected to provide support.
Note the levels of interest below:
- Pivot support is noted at 2023.47, 2012.53, 2005.44
- Pivot resistance is noted at 2041.5, 2048.59, 2059.53
| Levels | Levels.1 |
|---|---|
| Previous Daily High | 2037.65 |
| Previous Daily Low | 2019.62 |
| Previous Weekly High | 2079.76 |
| Previous Weekly Low | 1977.12 |
| Previous Monthly High | 2048.75 |
| Previous Monthly Low | 1949.83 |
| Daily Fibonacci 38.2% | 2030.76 |
| Daily Fibonacci 61.8% | 2026.51 |
| Daily Pivot Point S1 | 2023.47 |
| Daily Pivot Point S2 | 2012.53 |
| Daily Pivot Point S3 | 2005.44 |
| Daily Pivot Point R1 | 2041.50 |
| Daily Pivot Point R2 | 2048.59 |
| Daily Pivot Point R3 | 2059.53 |
[/s2If]
Nehcap Expert Advisor
The NEHCAP MT4 EA is high quality professional trading system geared to generate returns without using GRID or martingales. Each trade has strict risk per trade parameter. The pairs under management include EURUSD, GBPUSD, AUDCAD, AUDNZD,GBPAUD, EURAUD, EURCAD, CHFJPY and many more.
The system is trading live: LIVE ACCOUNT TRACKING
You can run it free. Apply for a free trial and track our account. Buy the system or use profit share mechanism to generate returns on your MT4.
Join Our Telegram Group
")


