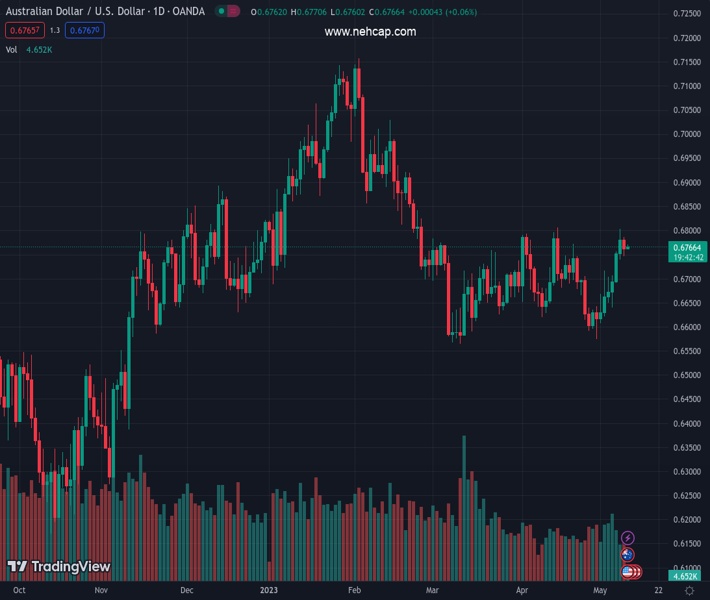
#AUDUSD @ 0.67669 struggle to consolidate the first daily loss in seven amid sluggish markets, eases from intraday top of late. (Pivot Orderbook analysis)
…
This is a premium post.
[s2If !current_user_can(access_s2member_level4)]Please register for FREE REGISTER to read full post below containing analysis. In case of any error or you think you are not able to read the full post below, please email us at support#nehcap.com [lwa][/s2If] [s2If current_user_can(access_s2member_level1)]
- AUD/USD struggle to consolidate the first daily loss in seven amid sluggish markets, eases from intraday top of late.
- Market sentiment dwindles as US policymakers fail to sold debt ceiling riddle on first attempt.
- Light calendar ahead of US CPI for April keeps Aussie traders on their toes.
The pair currently trades last at 0.67669.
The previous day high was 0.6787 while the previous day low was 0.6746. The daily 38.2% Fib levels comes at 0.6762, expected to provide support. Similarly, the daily 61.8% fib level is at 0.6771, expected to provide resistance.
AUD/USD seesaws around intraday high, making rounds to 0.6770-60 of late, as it bears the burden of the market’s cautious mood, as well as recently softer second-tier Aussie data, during early Wednesday.
Risk appetite remains sluggish as failed debt ceiling talks in the White House joined looming fears of the US banking sector fallouts. On the same line could be the market’s preparations for the US inflation data, namely the Consumer Price Index (CPI) for April.
US Senate Majority Leader Chuck Schumer conveyed the absence of progress in the key debt-ceiling talks at the White House. Following that, US President Joe Biden called the meeting “productive” and reported that House Speaker Kevin McCarthy said during the meeting that the US would not default on its debt, per Reuters. The news also quotes US House Speaker McCarthy saying that the two sides agreed for their staff to get together this week, and for the principals to meet again on Friday to continue talking.
Following a disappointment from the White House, the global rating giant Moody’s recently said, “What once seemed unimaginable now seems a real threat.”
It’s worth noting that International Monetary Fund’s (IMF) Chief Economist Pierre-Olivier Gourinchas cited banking fears on Tuesday, following the Fed’s quarterly survey of bank loan officers, released on Monday, cited the negative impact of higher rates on credit conditions.
Talking about the data, Australia’s Roy Morgan Business Confidence for April dropped to 90.2, from 93.6 prior. On the other hand, the US sentiment gauges have also been downbeat while Aussie Retail Sales and China trade numbers disappointed AUD/USD bulls the previous day.
Amid these plays, the US Dollar Index (DXY) retreats to 101.55, pausing the two-day winning streak, whereas the US 10-year Treasury bond yields remain sidelined near 3.51% after rising in the last four consecutive days.
Given the hopes of softer US inflation and the US policymakers’ ability to tackle the debt-ceiling expiration, despite the latest failure, the AUD/USD prices may grind higher ahead of the key US CPI data.
Also read: US April CPI Preview: How will inflation data influence Fed rate outlook?
Although the 100-DMA prods AUD/USD buyers around 0.6790, the pair’s downside needs validation from an ascending support line from April 28, close to 0.6755 by the press time.
Technical Levels: Supports and Resistances
AUDUSD currently trading at 0.6764 at the time of writing. Pair opened at 0.6762 and is trading with a change of 0.03% % .
| Overview | Overview.1 | |
|---|---|---|
| 0 | Today last price | 0.6764 |
| 1 | Today Daily Change | 0.0002 |
| 2 | Today Daily Change % | 0.03% |
| 3 | Today daily open | 0.6762 |
The pair is trading above its 20 Daily moving average @ 0.6693, above its 50 Daily moving average @ 0.6685 , below its 100 Daily moving average @ 0.679 and above its 200 Daily moving average @ 0.6727
| Trends | Trends.1 | |
|---|---|---|
| 0 | Daily SMA20 | 0.6693 |
| 1 | Daily SMA50 | 0.6685 |
| 2 | Daily SMA100 | 0.6790 |
| 3 | Daily SMA200 | 0.6727 |
The previous day high was 0.6787 while the previous day low was 0.6746. The daily 38.2% Fib levels comes at 0.6762, expected to provide support. Similarly, the daily 61.8% fib level is at 0.6771, expected to provide resistance.
Note the levels of interest below:
- Pivot support is noted at 0.6743, 0.6725, 0.6703
- Pivot resistance is noted at 0.6784, 0.6805, 0.6824
| Levels | Levels.1 |
|---|---|
| Previous Daily High | 0.6787 |
| Previous Daily Low | 0.6746 |
| Previous Weekly High | 0.6757 |
| Previous Weekly Low | 0.6607 |
| Previous Monthly High | 0.6806 |
| Previous Monthly Low | 0.6574 |
| Daily Fibonacci 38.2% | 0.6762 |
| Daily Fibonacci 61.8% | 0.6771 |
| Daily Pivot Point S1 | 0.6743 |
| Daily Pivot Point S2 | 0.6725 |
| Daily Pivot Point S3 | 0.6703 |
| Daily Pivot Point R1 | 0.6784 |
| Daily Pivot Point R2 | 0.6805 |
| Daily Pivot Point R3 | 0.6824 |
[/s2If]
Nehcap Expert Advisor
The NEHCAP MT4 EA is high quality professional trading system geared to generate returns without using GRID or martingales. Each trade has strict risk per trade parameter. The pairs under management include EURUSD, GBPUSD, AUDCAD, AUDNZD,GBPAUD, EURAUD, EURCAD, CHFJPY and many more.
The system is trading live: LIVE ACCOUNT TRACKING
You can run it free. Apply for a free trial and track our account. Buy the system or use profit share mechanism to generate returns on your MT4.
Join Our Telegram Group
")


