#NZDUSD @ 0.63379 is looking to reclaim 0.6360 as US debt ceiling talks are scheduled for Friday for further negotiations. (Pivot Orderbook analysis)
…
This is a premium post.
[s2If !current_user_can(access_s2member_level4)]Please register for FREE REGISTER to read full post below containing analysis. In case of any error or you think you are not able to read the full post below, please email us at support#nehcap.com [lwa][/s2If] [s2If current_user_can(access_s2member_level1)]
- NZD/USD is looking to reclaim 0.6360 as US debt ceiling talks are scheduled for Friday for further negotiations.
- US debt ceiling talks ended without a conclusion as Speaker McCarthy denied agreeing on default off the table.
- As per the consensus, China’s monthly inflation remained stagnant while annual inflation accelerated by 0.3%.
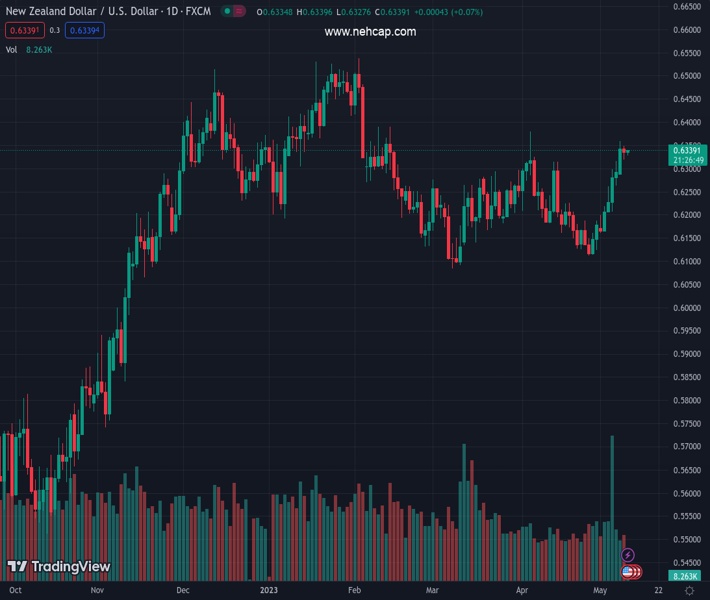
The pair currently trades last at 0.63379.
The previous day high was 0.636 while the previous day low was 0.6292. The daily 38.2% Fib levels comes at 0.6334, expected to provide support. Similarly, the daily 61.8% fib level is at 0.6318, expected to provide support.
The NZD/USD pair has stretched its recovery to near 0.6336 in the early Asian session. The Kiwi asset is expected to remain on the tenterhooks as negotiations for US debt ceiling issues between US President Joe Biden and Speaker Kevin McCarthy are heating as the latter is not ready to agree to support debt ceiling raise without cutting spending initiatives.
At the White House official, US President Joe Biden has cited that McCarthy’s spending cuts will hurt Americans. However, for a major development, investors have to wait till Friday as agreed but volatility will remain at elevated levels until both parties reach a conclusion.
Meanwhile, S&P500 futures have added minimal gains in the Asian session after a bearish Tuesday. Synergic uncertainty due to US debt ceiling talks and inflation figures capped the upside for US equities. The US Dollar Index (DXY) has recovered to near 101.65 and further action will be directed by inflation data. The overall market mood portrays caution as April’s US Consumer Price Index (CPI) data carries significant importance.
The Federal Reserve (Fed) has already conveyed that it will be more data-centric onwards. April’s Employment report has signaled that Fed chair Jerome Powell would keep interest rates higher for a longer period and now persistent inflationary pressures could fuel the need for more rate hikes ahead.
On Tuesday, New York Federal Reserve (Fed) Bank President John Williams cited that the central bank has not said that it’s done with raising rates. Fed policymaker doesn’t see any reason of rate cuts this year as tight credit conditions by commercial banks are not expected to knock out the economy.
On the New Zealand Dollar front, after recording slower growth in Chinese exports and weakness in domestic demand, investors are shifting their focus toward the inflation data (April). As per the preliminary report, monthly inflation is seen stagnant against March’s deceleration of 0.3%. Annual inflation is expected to accelerate by 0.3% at a slower pace vs. the prior release of 0.7%.
It is worth noting that New Zealand is one of the leading trading partners of China and higher inflation in China would signal strong domestic recovery, which might support the New Zealand Dollar.
Technical Levels: Supports and Resistances
NZDUSD currently trading at 0.6338 at the time of writing. Pair opened at 0.6344 and is trading with a change of -0.09 % .
| Overview | Overview.1 | |
|---|---|---|
| 0 | Today last price | 0.6338 |
| 1 | Today Daily Change | -0.0006 |
| 2 | Today Daily Change % | -0.0900 |
| 3 | Today daily open | 0.6344 |
The pair remains strongly bullish on the daily timeframe. It trades above its 20 SMA @ 0.6203, 50 SMA 0.6214, 100 SMA @ 0.6279 and 200 SMA @ 0.616.
| Trends | Trends.1 | |
|---|---|---|
| 0 | Daily SMA20 | 0.6203 |
| 1 | Daily SMA50 | 0.6214 |
| 2 | Daily SMA100 | 0.6279 |
| 3 | Daily SMA200 | 0.6160 |
The previous day high was 0.636 while the previous day low was 0.6292. The daily 38.2% Fib levels comes at 0.6334, expected to provide support. Similarly, the daily 61.8% fib level is at 0.6318, expected to provide support.
Note the levels of interest below:
- Pivot support is noted at 0.6304, 0.6264, 0.6236
- Pivot resistance is noted at 0.6372, 0.64, 0.644
| Levels | Levels.1 |
|---|---|
| Previous Daily High | 0.6360 |
| Previous Daily Low | 0.6292 |
| Previous Weekly High | 0.6316 |
| Previous Weekly Low | 0.6160 |
| Previous Monthly High | 0.6389 |
| Previous Monthly Low | 0.6111 |
| Daily Fibonacci 38.2% | 0.6334 |
| Daily Fibonacci 61.8% | 0.6318 |
| Daily Pivot Point S1 | 0.6304 |
| Daily Pivot Point S2 | 0.6264 |
| Daily Pivot Point S3 | 0.6236 |
| Daily Pivot Point R1 | 0.6372 |
| Daily Pivot Point R2 | 0.6400 |
| Daily Pivot Point R3 | 0.6440 |
[/s2If]
Nehcap Expert Advisor
The NEHCAP MT4 EA is high quality professional trading system geared to generate returns without using GRID or martingales. Each trade has strict risk per trade parameter. The pairs under management include EURUSD, GBPUSD, AUDCAD, AUDNZD,GBPAUD, EURAUD, EURCAD, CHFJPY and many more.
The system is trading live: LIVE ACCOUNT TRACKING
You can run it free. Apply for a free trial and track our account. Buy the system or use profit share mechanism to generate returns on your MT4.
Join Our Telegram Group
")


