#USDCAD @ 1.33781 fades the week-start bounce off the lowest levels since mid-April., @nehcap view: Further downside expected (Pivot Orderbook analysis)
…
This is a premium post.
[s2If !current_user_can(access_s2member_level4)]Please register for FREE REGISTER to read full post below containing analysis. In case of any error or you think you are not able to read the full post below, please email us at support#nehcap.com [lwa][/s2If] [s2If current_user_can(access_s2member_level1)]
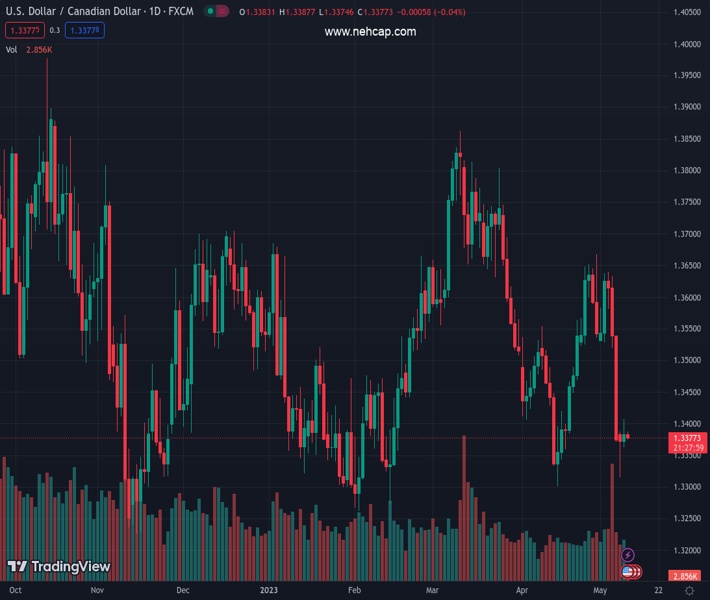
- USD/CAD fades the week-start bounce off the lowest levels since mid-April.
- Failure to cross five-week-old horizontal hurdle, downbeat oscillators keep sellers hopeful.
- Loonie pair buyers need to takeout 1.3620 to regain powers.
The pair currently trades last at 1.33781.
The previous day high was 1.3388 while the previous day low was 1.3315. The daily 38.2% Fib levels comes at 1.336, expected to provide support. Similarly, the daily 61.8% fib level is at 1.3343, expected to provide support.
USD/CAD retreats to 1.3380 during early Wednesday in Asia, fading the previous two-day rebound from a monthly low, as traders await the key US inflation numbers for April. Also allowing the Loonie pair traders to consolidate recent gains can be the latest US debt-ceiling jitters are policymakers failed to solve the riddle in the first trial.
Also read: US President Biden, House Speaker McCarthy divided over debt ceiling but still talking
Apart from the risk catalysts, the quote’s failure to cross a horizontal resistance area comprising multiple levels marked since early April, around 1.3405-10, also weigh on the USD/CAD prices.
Furthermore, RSI (14) rebound from the oversold territory and sluggish MACD signals also prod the USD/CAD buyers
With this, the Loonie pair appears all set to challenge a one-month-old horizontal support zone surrounding 1.3315-3300.
Following that, lows marked in February and late 2022, near 1.3260 and 1.3225 in that order, will be in the spotlight.
Alternatively, the USD/CAD pair’s recovery moves past the 1.3410 immediate hurdle isn’t an open welcome to the Loonie pair buyers as the 200-SMA and five-week-old horizontal area, near 1.3510 and 1.3530 respectively, can check the upside moves.
It’s worth noting that a downward-sloping resistance line from March 10, close to 1.3620 by the press time, appears the last defense of the USD/CAD bears.
Trend: Further downside expected
Technical Levels: Supports and Resistances
USDCAD currently trading at 1.338 at the time of writing. Pair opened at 1.3375 and is trading with a change of 0.04% % .
| Overview | Overview.1 | |
|---|---|---|
| 0 | Today last price | 1.338 |
| 1 | Today Daily Change | 0.0005 |
| 2 | Today Daily Change % | 0.04% |
| 3 | Today daily open | 1.3375 |
The pair remains strongly bearish on the daily time frame. It trades below the 20 SMA @ 1.3495, 50 SMA 1.3581, 100 SMA @ 1.3521 and 200 SMA @ 1.3449.
| Trends | Trends.1 | |
|---|---|---|
| 0 | Daily SMA20 | 1.3495 |
| 1 | Daily SMA50 | 1.3581 |
| 2 | Daily SMA100 | 1.3521 |
| 3 | Daily SMA200 | 1.3449 |
The previous day high was 1.3388 while the previous day low was 1.3315. The daily 38.2% Fib levels comes at 1.336, expected to provide support. Similarly, the daily 61.8% fib level is at 1.3343, expected to provide support.
Note the levels of interest below:
- Pivot support is noted at 1.3331, 1.3286, 1.3258
- Pivot resistance is noted at 1.3404, 1.3432, 1.3476
| Levels | Levels.1 |
|---|---|
| Previous Daily High | 1.3388 |
| Previous Daily Low | 1.3315 |
| Previous Weekly High | 1.3639 |
| Previous Weekly Low | 1.3371 |
| Previous Monthly High | 1.3668 |
| Previous Monthly Low | 1.3301 |
| Daily Fibonacci 38.2% | 1.3360 |
| Daily Fibonacci 61.8% | 1.3343 |
| Daily Pivot Point S1 | 1.3331 |
| Daily Pivot Point S2 | 1.3286 |
| Daily Pivot Point S3 | 1.3258 |
| Daily Pivot Point R1 | 1.3404 |
| Daily Pivot Point R2 | 1.3432 |
| Daily Pivot Point R3 | 1.3476 |
[/s2If]
Nehcap Expert Advisor
The NEHCAP MT4 EA is high quality professional trading system geared to generate returns without using GRID or martingales. Each trade has strict risk per trade parameter. The pairs under management include EURUSD, GBPUSD, AUDCAD, AUDNZD,GBPAUD, EURAUD, EURCAD, CHFJPY and many more.
The system is trading live: LIVE ACCOUNT TRACKING
You can run it free. Apply for a free trial and track our account. Buy the system or use profit share mechanism to generate returns on your MT4.
Join Our Telegram Group
")


