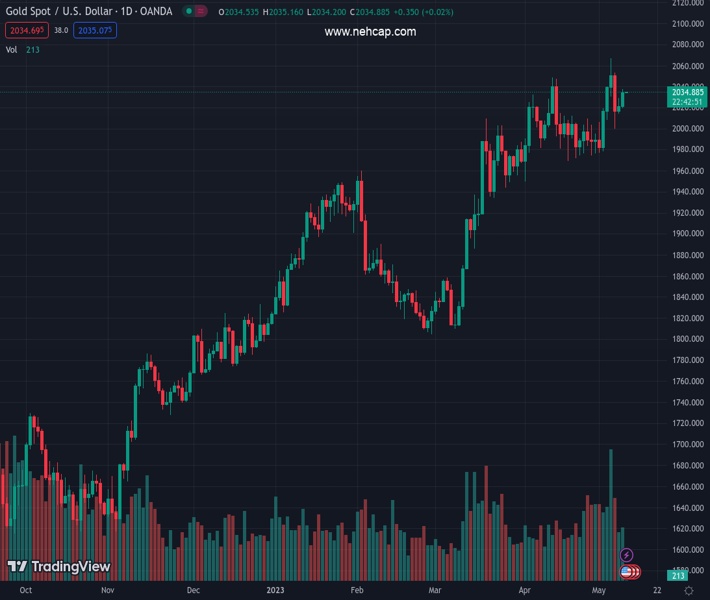
#XAUUSD @ 2,034.96 Gold price has surpassed comfortably above $2,030.00 amid uncertainty over the outcome of US debt ceiling talks. (Pivot Orderbook analysis)
…
This is a premium post.
[s2If !current_user_can(access_s2member_level4)]Please register for FREE REGISTER to read full post below containing analysis. In case of any error or you think you are not able to read the full post below, please email us at support#nehcap.com [lwa][/s2If] [s2If current_user_can(access_s2member_level1)]
- Gold price has surpassed comfortably above $2,030.00 amid uncertainty over the outcome of US debt ceiling talks.
- The US Dollar Index has rebounded to near 101.64 ahead of the US Inflation data.
- Fed Williams is of the view that the central banks have not said it’s done with raising rates.
The pair currently trades last at 2034.96.
The previous day high was 2029.41 while the previous day low was 2014.36. The daily 38.2% Fib levels comes at 2023.66, expected to provide support. Similarly, the daily 61.8% fib level is at 2020.11, expected to provide support.
Gold price (XAU/USD) has climbed above the $2,030.00 resistance and has shifted its auction above the same in the early Asian session. The upside move in the precious metal is being supported by uncertainty over US debt ceiling talks between US President Joe Biden and some Republican leaders.
S&P500 went through some sell-off on Monday as investors were worried that the absence of any decisive outcome in the debt-ceiling negotiations would impact the outlook of the United States economy, portraying a risk-off mood. The US Dollar Index (DXY) has rebounded to near 101.64 as the downside seems defended ahead of the US inflation data.
At one place where US President Joe Biden was not interested in raising the debt ceiling at the cost of the President’s spending initiatives, Republican House of Representatives Speaker Kevin McCarthy already made clear that he won’t approve debt ceiling raise without cutting President’s spending initiative to safeguard escalating budget deficit.
Meanwhile, hawkish commentary from New York Federal Reserve (Fed) Bank President John Williams has also added to the overall uncertainty in the market. Fed policymakers cited that the central bank needs to be data-dependent with monetary policy and reminded that the Fed will raise rates again if needed. He further added that the Fed has not said it’s done with raising rates and see no reason for rate cuts this year.
Gold price is auctioning in a Rising Channel chart pattern on a four-hour scale. The upper portion of the aforementioned chart pattern is placed from March 20 high at $2,009.88 while the lower portion is plotted from March 22 low at $1,934.34.
The 20-period Exponential Moving Average (EMA) at $2,027.58 is acting as a cushion for the Gold bulls.
Meanwhile, the Relative Strength Index (RSI) (14) is making efforts for shifting into the bullish range of 60.00-80.00. An occurrence of the same will result in the activation of the upside momentum.
Technical Levels: Supports and Resistances
XAUUSD currently trading at 2034.41 at the time of writing. Pair opened at 2021.16 and is trading with a change of 0.66 % .
| Overview | Overview.1 | |
|---|---|---|
| 0 | Today last price | 2034.41 |
| 1 | Today Daily Change | 13.25 |
| 2 | Today Daily Change % | 0.66 |
| 3 | Today daily open | 2021.16 |
The pair remains strongly bullish on the daily timeframe. It trades above its 20 SMA @ 2006.29, 50 SMA 1956.97, 100 SMA @ 1911.16 and 200 SMA @ 1815.94.
| Trends | Trends.1 | |
|---|---|---|
| 0 | Daily SMA20 | 2006.29 |
| 1 | Daily SMA50 | 1956.97 |
| 2 | Daily SMA100 | 1911.16 |
| 3 | Daily SMA200 | 1815.94 |
The previous day high was 2029.41 while the previous day low was 2014.36. The daily 38.2% Fib levels comes at 2023.66, expected to provide support. Similarly, the daily 61.8% fib level is at 2020.11, expected to provide support.
Note the levels of interest below:
- Pivot support is noted at 2013.88, 2006.59, 1998.83
- Pivot resistance is noted at 2028.93, 2036.69, 2043.98
| Levels | Levels.1 |
|---|---|
| Previous Daily High | 2029.41 |
| Previous Daily Low | 2014.36 |
| Previous Weekly High | 2079.76 |
| Previous Weekly Low | 1977.12 |
| Previous Monthly High | 2048.75 |
| Previous Monthly Low | 1949.83 |
| Daily Fibonacci 38.2% | 2023.66 |
| Daily Fibonacci 61.8% | 2020.11 |
| Daily Pivot Point S1 | 2013.88 |
| Daily Pivot Point S2 | 2006.59 |
| Daily Pivot Point S3 | 1998.83 |
| Daily Pivot Point R1 | 2028.93 |
| Daily Pivot Point R2 | 2036.69 |
| Daily Pivot Point R3 | 2043.98 |
[/s2If]
Nehcap Expert Advisor
The NEHCAP MT4 EA is high quality professional trading system geared to generate returns without using GRID or martingales. Each trade has strict risk per trade parameter. The pairs under management include EURUSD, GBPUSD, AUDCAD, AUDNZD,GBPAUD, EURAUD, EURCAD, CHFJPY and many more.
The system is trading live: LIVE ACCOUNT TRACKING
You can run it free. Apply for a free trial and track our account. Buy the system or use profit share mechanism to generate returns on your MT4.
Join Our Telegram Group
")


