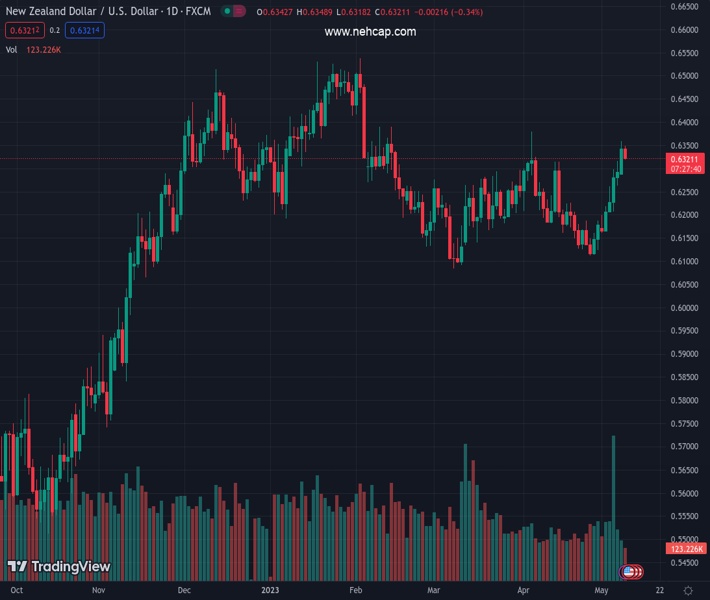
#NZDUSD @ 0.63218 edges lower on Tuesday and snaps a five-day winning streak to over a one-month top. (Pivot Orderbook analysis)
…
This is a premium post.
[s2If !current_user_can(access_s2member_level4)]Please register for FREE REGISTER to read full post below containing analysis. In case of any error or you think you are not able to read the full post below, please email us at support#nehcap.com [lwa][/s2If] [s2If current_user_can(access_s2member_level1)]
- NZD/USD edges lower on Tuesday and snaps a five-day winning streak to over a one-month top.
- A combination of factors assists the USD to gain some follow-through traction and exerts pressure.
- The technical setup still favours bullish traders and supports prospects for further near-term gains.
The pair currently trades last at 0.63218.
The previous day high was 0.636 while the previous day low was 0.6292. The daily 38.2% Fib levels comes at 0.6334, expected to provide resistance. Similarly, the daily 61.8% fib level is at 0.6318, expected to provide support.
The NZD/USD pair attracts some sellers on Tuesday and snaps a five-day winning streak to over a one-month high, around the 0.6355-0.6360 area touched the previous day. The pair maintains its offered tone through the early North American session and is currently placed near the daily low, still comfortably above the 0.6300 round-figure mark.
The US Dollar (USD) gains some positive traction for the second successive day and turns out to be a key factor exerting some downward pressure on the NZD/USD pair. The Federal Reserve’s (Fed) Senior Loan Officer Opinion Survey (SLOOS) released on Monday eased fears of a full-blown banking crisis in the US. Apart from this, a generally weaker tone around the equity markets further benefits the safe-haven Greenback and contributes to the offered tone surrounding the risk-sensitive Kiwi.
That said, growing acceptance of an imminent pause in the Federal Reserve’s (Fed) year-long rate-hiking cycle might hold back the USD bulls from placing aggressive bets. This, along with expectations for further rate hikes by the Reserve Bank of New Zealand (RBNZ), should limit losses for the NZD/USD pair. Market participants might also prefer to wait on the sidelines ahead of the release of the latest US consumer inflation figures, due on Wednesday, before positioning for the next directional move.
Even from a technical perspective, the overnight sustained break through a downward sloping trend line, extending from the YTD peak touched in February, favours bullish traders. Moreover, oscillators on the daily chart are holding in the positive territory and are still far from being in the overbought zone. This, in turn, supports prospects for an extension of the recent appreciating move witnessed over the past two weeks or so. Hence, the ongoing corrective slide is likely to get bought into.
The NZD/USD pair seems poised to climb back towards retesting the April monthly swing low, around the 0.6380 region, en route to the 0.6400 mark. Some follow-through buying should pave the way for additional gains and has the potential to lift spot prices towards the next relevant hurdle near the 0.6435-0.6440 region, above which bulls might aim to reclaim the 0.6500 psychological mark.
On the flip side, the aforementioned trend-line resistance breakpoint, currently around the 0.6300 round-figure mark, now seems to protect the immediate downside. Any further decline is likely to attract fresh buyers and remains limited near the 100-day Simple Moving Average (SMA), around the 0.6255 zone. The latter should act as a strong base for the NZD/USD pair, which if broken decisively will set the stage for a deeper corrective decline.
Technical Levels: Supports and Resistances
NZDUSD currently trading at 0.6322 at the time of writing. Pair opened at 0.6344 and is trading with a change of -0.35 % .
| Overview | Overview.1 | |
|---|---|---|
| 0 | Today last price | 0.6322 |
| 1 | Today Daily Change | -0.0022 |
| 2 | Today Daily Change % | -0.3500 |
| 3 | Today daily open | 0.6344 |
The pair remains strongly bullish on the daily timeframe. It trades above its 20 SMA @ 0.6203, 50 SMA 0.6214, 100 SMA @ 0.6279 and 200 SMA @ 0.616.
| Trends | Trends.1 | |
|---|---|---|
| 0 | Daily SMA20 | 0.6203 |
| 1 | Daily SMA50 | 0.6214 |
| 2 | Daily SMA100 | 0.6279 |
| 3 | Daily SMA200 | 0.6160 |
The previous day high was 0.636 while the previous day low was 0.6292. The daily 38.2% Fib levels comes at 0.6334, expected to provide resistance. Similarly, the daily 61.8% fib level is at 0.6318, expected to provide support.
Note the levels of interest below:
- Pivot support is noted at 0.6304, 0.6264, 0.6236
- Pivot resistance is noted at 0.6372, 0.64, 0.644
| Levels | Levels.1 |
|---|---|
| Previous Daily High | 0.6360 |
| Previous Daily Low | 0.6292 |
| Previous Weekly High | 0.6316 |
| Previous Weekly Low | 0.6160 |
| Previous Monthly High | 0.6389 |
| Previous Monthly Low | 0.6111 |
| Daily Fibonacci 38.2% | 0.6334 |
| Daily Fibonacci 61.8% | 0.6318 |
| Daily Pivot Point S1 | 0.6304 |
| Daily Pivot Point S2 | 0.6264 |
| Daily Pivot Point S3 | 0.6236 |
| Daily Pivot Point R1 | 0.6372 |
| Daily Pivot Point R2 | 0.6400 |
| Daily Pivot Point R3 | 0.6440 |
[/s2If]
Nehcap Expert Advisor
The NEHCAP MT4 EA is high quality professional trading system geared to generate returns without using GRID or martingales. Each trade has strict risk per trade parameter. The pairs under management include EURUSD, GBPUSD, AUDCAD, AUDNZD,GBPAUD, EURAUD, EURCAD, CHFJPY and many more.
The system is trading live: LIVE ACCOUNT TRACKING
You can run it free. Apply for a free trial and track our account. Buy the system or use profit share mechanism to generate returns on your MT4.
Join Our Telegram Group
")


