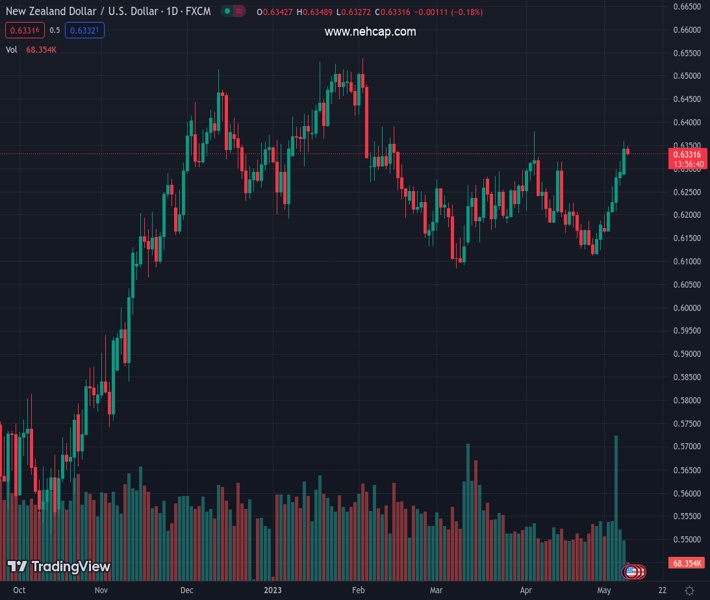
#NZDUSD @ 0.63326 pulls back from over a one-month high touched on Monday, though lacks follow-through. (Pivot Orderbook analysis)
…
This is a premium post.
[s2If !current_user_can(access_s2member_level4)]Please register for FREE REGISTER to read full post below containing analysis. In case of any error or you think you are not able to read the full post below, please email us at support#nehcap.com [lwa][/s2If] [s2If current_user_can(access_s2member_level1)]
- NZD/USD pulls back from over a one-month high touched on Monday, though lacks follow-through.
- The overnight rise in the US bond yields underpins the USD and acts as a headwind for the major.
- The Fed’s less hawkish outlook could cap the USD and lend support to the pair ahead of the US CPI.
The pair currently trades last at 0.63326.
The previous day high was 0.636 while the previous day low was 0.6292. The daily 38.2% Fib levels comes at 0.6334, expected to provide resistance. Similarly, the daily 61.8% fib level is at 0.6318, expected to provide support.
The NZD/USD pair edges lower on Tuesday and for now, seems to have snapped a five-day winning streak to over a one-month high touched the previous day. The pair remains on the defensive through the early European session and is currently placed around the 0.6335-0.6330 region, though any meaningful downfall still seems elusive.
The overnight sharp rally in the US Treasury bond yields continues to lend some support to the US Dollar (USD), which, in turn, is seen as a key factor acting as a headwind for the NZD/USD pair. The Federal Reserve’s (Fed) quarterly Senior Loan Officer Opinion Survey (SLOOS) released on Monday showed that tightening credit conditions for US businesses and households was due to the aggressive rate hikes rather than severe banking sector stress. This, in turn, fueled hopes that the US banking sector is not headed for a wider crisis and pushed the US bond yields higher.
The upside for the USD, however, remains capped in the wake of a less hawkish stance adopted by the Fed. It is worth recalling that the US central bank last week outlined a more stringent, data-driven approach to raising rates further and opened the door for an imminent pause in its year-long rate-hiking cycle. Moreover, the markets have also started pricing in the possibility that the Fed will begin cutting rates in the second half of this year. This, along with expectations for further rate hikes by the Reserve Bank of New Zealand (RBNZ), should limit losses for the NZD/USD pair.
Traders might also refrain from placing aggressive bets and prefer to wait for the release of the latest US consumer inflation figures on Wednesday. The crucial US CPI report will influence market expectations about the Fed’s next policy move, which, in turn, will play a key role in driving the near-term USD demand and help determine the next leg of a directional move for the NZD/USD pair. In the meantime, traders on Tuesday will take cues from a scheduled speech by New York Fed President John Williams in the absence of any relevant macroeconomic releases from the US.
Technical Levels: Supports and Resistances
NZDUSD currently trading at 0.6334 at the time of writing. Pair opened at 0.6344 and is trading with a change of -0.16 % .
| Overview | Overview.1 | |
|---|---|---|
| 0 | Today last price | 0.6334 |
| 1 | Today Daily Change | -0.0010 |
| 2 | Today Daily Change % | -0.1600 |
| 3 | Today daily open | 0.6344 |
The pair remains strongly bullish on the daily timeframe. It trades above its 20 SMA @ 0.6203, 50 SMA 0.6214, 100 SMA @ 0.6279 and 200 SMA @ 0.616.
| Trends | Trends.1 | |
|---|---|---|
| 0 | Daily SMA20 | 0.6203 |
| 1 | Daily SMA50 | 0.6214 |
| 2 | Daily SMA100 | 0.6279 |
| 3 | Daily SMA200 | 0.6160 |
The previous day high was 0.636 while the previous day low was 0.6292. The daily 38.2% Fib levels comes at 0.6334, expected to provide resistance. Similarly, the daily 61.8% fib level is at 0.6318, expected to provide support.
Note the levels of interest below:
- Pivot support is noted at 0.6304, 0.6264, 0.6236
- Pivot resistance is noted at 0.6372, 0.64, 0.644
| Levels | Levels.1 |
|---|---|
| Previous Daily High | 0.6360 |
| Previous Daily Low | 0.6292 |
| Previous Weekly High | 0.6316 |
| Previous Weekly Low | 0.6160 |
| Previous Monthly High | 0.6389 |
| Previous Monthly Low | 0.6111 |
| Daily Fibonacci 38.2% | 0.6334 |
| Daily Fibonacci 61.8% | 0.6318 |
| Daily Pivot Point S1 | 0.6304 |
| Daily Pivot Point S2 | 0.6264 |
| Daily Pivot Point S3 | 0.6236 |
| Daily Pivot Point R1 | 0.6372 |
| Daily Pivot Point R2 | 0.6400 |
| Daily Pivot Point R3 | 0.6440 |
[/s2If]
Nehcap Expert Advisor
The NEHCAP MT4 EA is high quality professional trading system geared to generate returns without using GRID or martingales. Each trade has strict risk per trade parameter. The pairs under management include EURUSD, GBPUSD, AUDCAD, AUDNZD,GBPAUD, EURAUD, EURCAD, CHFJPY and many more.
The system is trading live: LIVE ACCOUNT TRACKING
You can run it free. Apply for a free trial and track our account. Buy the system or use profit share mechanism to generate returns on your MT4.
Join Our Telegram Group
")


