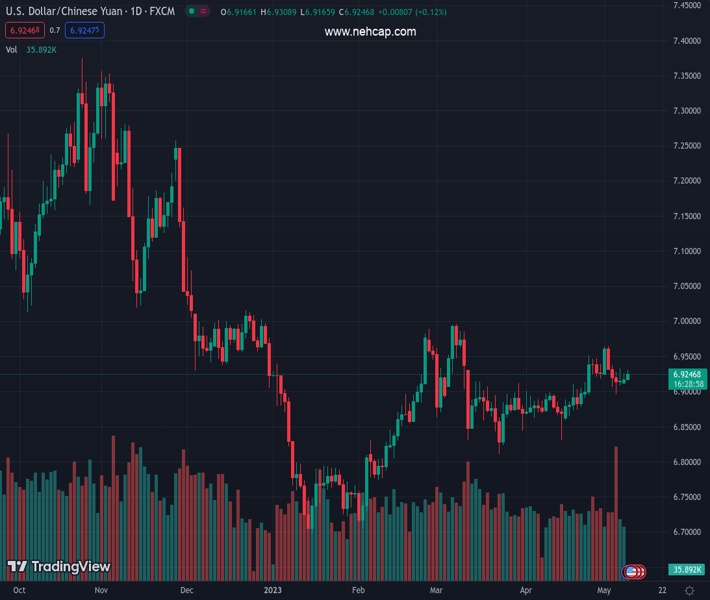
#USDCNH @ 6.92407 has dropped from 6.9300 amid the release of the better-than-projected Chinese Trade Balance data. (Pivot Orderbook analysis)
…
This is a premium post.
[s2If !current_user_can(access_s2member_level4)]Please register for FREE REGISTER to read full post below containing analysis. In case of any error or you think you are not able to read the full post below, please email us at support#nehcap.com [lwa][/s2If] [s2If current_user_can(access_s2member_level1)]
- USD/CNH has dropped from 6.9300 amid the release of the better-than-projected Chinese Trade Balance data.
- China’s Trade Balance report indicated that domestic demand is not showing signs of recovery.
- Credit distribution figures by US banks have started declining due to weaker demand and tight credit conditions.
The pair currently trades last at 6.92407.
The previous day high was 6.926 while the previous day low was 6.916. The daily 38.2% Fib levels comes at 6.9199, expected to provide support. Similarly, the daily 61.8% fib level is at 6.9222, expected to provide support.
The USD/CNH has dropped from 6.9300 after the release of the better-than-anticipated China Trade Balance data. China’s National Bureau of Statistics (NBS) has reported a bigger-than-expected growth in the trade surplus as imports slump in the reported period.
Trade Balance (in $ terms) came in at +90.21B versus +71.6B as expected and +88.19B recorded previously. The exports jumped by another 8.5% in the reported period vs. the 8.0% expected but lower than the prior acceleration pace of 14.8%. However, the country’s imports fell by 7.9% while the street was anticipating a stagnant performance. In the prior period, imports dropped by 1.4%.
Scrutiny of China’s Trade Balance report indicates that domestic demand is not showing signs of recovery despite monetary and fiscal support from the administration. No doubt, export figures have beaten expectations but a slower growth against the prior pace is indicating a challenging outlook for the economy. This week, Financial Times reported that the European Union is planning sanctions on Chinese firms for supporting Russia’s war on Ukraine. An occurrence of the same could weigh some burden on China’s exports ahead.
Upside pressure in the USD/CNH pair has also been fueled by a mild correction in the US Dollar Index (DXY). The USD Index is struggling in extending its recovery above 101.50 amid soaring uncertainty over US Consumer Price Index (CPI) data, which will release on Wednesday.
A steady US inflation report is expected to keep expectations of a pause by the Federal Reserve (Fed) intact as credit disbursement figures by US commercial banks have started declining due to weaker demand and tight credit conditions.
Technical Levels: Supports and Resistances
USDCNH currently trading at 6.9252 at the time of writing. Pair opened at 6.9204 and is trading with a change of 0.07 % .
| Overview | Overview.1 | |
|---|---|---|
| 0 | Today last price | 6.9252 |
| 1 | Today Daily Change | 0.0048 |
| 2 | Today Daily Change % | 0.0700 |
| 3 | Today daily open | 6.9204 |
The pair is trading above its 20 Daily moving average @ 6.9092, above its 50 Daily moving average @ 6.9013 , above its 100 Daily moving average @ 6.8739 and below its 200 Daily moving average @ 6.9586
| Trends | Trends.1 | |
|---|---|---|
| 0 | Daily SMA20 | 6.9092 |
| 1 | Daily SMA50 | 6.9013 |
| 2 | Daily SMA100 | 6.8739 |
| 3 | Daily SMA200 | 6.9586 |
The previous day high was 6.926 while the previous day low was 6.916. The daily 38.2% Fib levels comes at 6.9199, expected to provide support. Similarly, the daily 61.8% fib level is at 6.9222, expected to provide support.
Note the levels of interest below:
- Pivot support is noted at 6.9156, 6.9108, 6.9056
- Pivot resistance is noted at 6.9256, 6.9308, 6.9356
| Levels | Levels.1 |
|---|---|
| Previous Daily High | 6.9260 |
| Previous Daily Low | 6.9160 |
| Previous Weekly High | 6.9646 |
| Previous Weekly Low | 6.8962 |
| Previous Monthly High | 6.9508 |
| Previous Monthly Low | 6.8302 |
| Daily Fibonacci 38.2% | 6.9199 |
| Daily Fibonacci 61.8% | 6.9222 |
| Daily Pivot Point S1 | 6.9156 |
| Daily Pivot Point S2 | 6.9108 |
| Daily Pivot Point S3 | 6.9056 |
| Daily Pivot Point R1 | 6.9256 |
| Daily Pivot Point R2 | 6.9308 |
| Daily Pivot Point R3 | 6.9356 |
[/s2If]
Nehcap Expert Advisor
The NEHCAP MT4 EA is high quality professional trading system geared to generate returns without using GRID or martingales. Each trade has strict risk per trade parameter. The pairs under management include EURUSD, GBPUSD, AUDCAD, AUDNZD,GBPAUD, EURAUD, EURCAD, CHFJPY and many more.
The system is trading live: LIVE ACCOUNT TRACKING
You can run it free. Apply for a free trial and track our account. Buy the system or use profit share mechanism to generate returns on your MT4.
Join Our Telegram Group
")


