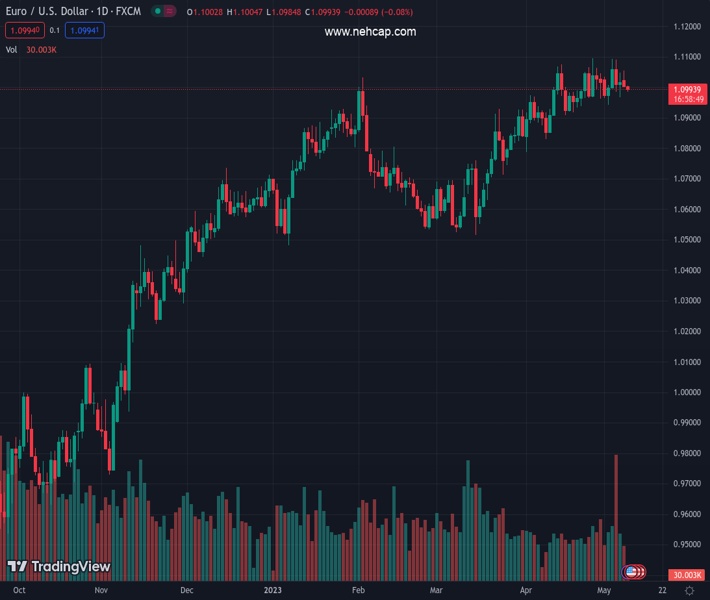
#EURUSD @ 1.09930 has tested waters below 1.1000 as the USD Index is eyeing more upside. (Pivot Orderbook analysis)
…
This is a premium post.
[s2If !current_user_can(access_s2member_level4)]Please register for FREE REGISTER to read full post below containing analysis. In case of any error or you think you are not able to read the full post below, please email us at support#nehcap.com [lwa][/s2If] [s2If current_user_can(access_s2member_level1)]
- EUR/USD has tested waters below 1.1000 as the USD Index is eyeing more upside.
- The Eurozone economy is swiftly approaching recession as retail demand is consistently declining.
- EUR/USD is showing signs of a significant loss in the upside momentum after refreshing its annual high at 1.1096.
The pair currently trades last at 1.09930.
The previous day high was 1.1054 while the previous day low was 1.1. The daily 38.2% Fib levels comes at 1.1021, expected to provide resistance. Similarly, the daily 61.8% fib level is at 1.1033, expected to provide resistance.
The EUR/USD pair has checked territory below the psychological support of 1.1000 in the Tokyo session. The major currency pair is expected to display more weakness as the US Dollar Index (DXY) is eyeing more upside above the immediate resistance of 101.50 ahead of the US inflation data.
As per the preliminary report, the US inflation is expected to remain steady. It seems that lower credit from commercial banks due to weak demand and tight credit conditions has been offset by higher households’ earnings.
Meanwhile, the Eurozone economy is swiftly approaching recession as retail demand is consistently declining and the growth rate has been squeezed sharply led by higher interest rates from the European Central Bank (ECB).
EUR/USD is showing signs of a significant loss in the upside momentum after refreshing its annual high at 1.1096. The shared currency pair is struggling to maintain an auction above the horizontal resistance plotted from February 02 high at 1.1033. The 20-period Exponential Moving Average (EMA) at 1.0983 is providing a cushion to the Euro.
An oscillation in the 40.00-60.00 range by the Relative Strength Index (RSI) (14) in indicating a lackluster performance ahead.
Should the asset break below May 02 low at 1.0942, a downside move by the US Dollar will drag the asset towards April 12 low at 1.0915 and April 10 low at 1.0837.
Alternatively, a recovery move above April 26 high at 1.1095 will drive the asset toward a fresh 13-month high at 1.1185 followed by the round-level resistance at 1.1200.
Technical Levels: Supports and Resistances
EURUSD currently trading at 1.099 at the time of writing. Pair opened at 1.1007 and is trading with a change of -0.15 % .
| Overview | Overview.1 | |
|---|---|---|
| 0 | Today last price | 1.0990 |
| 1 | Today Daily Change | -0.0017 |
| 2 | Today Daily Change % | -0.1500 |
| 3 | Today daily open | 1.1007 |
The pair is trading below its 20 Daily moving average @ 1.0997, above its 50 Daily moving average @ 1.0847 , above its 100 Daily moving average @ 1.0786 and above its 200 Daily moving average @ 1.0438
| Trends | Trends.1 | |
|---|---|---|
| 0 | Daily SMA20 | 1.0997 |
| 1 | Daily SMA50 | 1.0847 |
| 2 | Daily SMA100 | 1.0786 |
| 3 | Daily SMA200 | 1.0438 |
The previous day high was 1.1054 while the previous day low was 1.1. The daily 38.2% Fib levels comes at 1.1021, expected to provide resistance. Similarly, the daily 61.8% fib level is at 1.1033, expected to provide resistance.
Note the levels of interest below:
- Pivot support is noted at 1.0987, 1.0967, 1.0933
- Pivot resistance is noted at 1.104, 1.1074, 1.1094
| Levels | Levels.1 |
|---|---|
| Previous Daily High | 1.1054 |
| Previous Daily Low | 1.1000 |
| Previous Weekly High | 1.1092 |
| Previous Weekly Low | 1.0942 |
| Previous Monthly High | 1.1095 |
| Previous Monthly Low | 1.0788 |
| Daily Fibonacci 38.2% | 1.1021 |
| Daily Fibonacci 61.8% | 1.1033 |
| Daily Pivot Point S1 | 1.0987 |
| Daily Pivot Point S2 | 1.0967 |
| Daily Pivot Point S3 | 1.0933 |
| Daily Pivot Point R1 | 1.1040 |
| Daily Pivot Point R2 | 1.1074 |
| Daily Pivot Point R3 | 1.1094 |
[/s2If]
Nehcap Expert Advisor
The NEHCAP MT4 EA is high quality professional trading system geared to generate returns without using GRID or martingales. Each trade has strict risk per trade parameter. The pairs under management include EURUSD, GBPUSD, AUDCAD, AUDNZD,GBPAUD, EURAUD, EURCAD, CHFJPY and many more.
The system is trading live: LIVE ACCOUNT TRACKING
You can run it free. Apply for a free trial and track our account. Buy the system or use profit share mechanism to generate returns on your MT4.
Join Our Telegram Group
")


