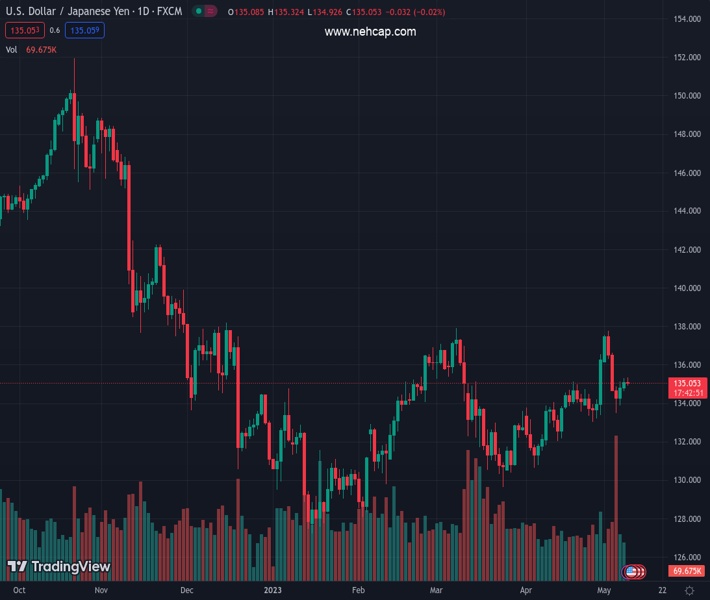
#USDJPY @ 135.057 fails to defend two-day uptrend as 200-HMA prods buyers., @nehcap view: Further recovery expected (Pivot Orderbook analysis)
…
This is a premium post.
[s2If !current_user_can(access_s2member_level4)]Please register for FREE REGISTER to read full post below containing analysis. In case of any error or you think you are not able to read the full post below, please email us at support#nehcap.com [lwa][/s2If] [s2If current_user_can(access_s2member_level1)]
- USD/JPY fails to defend two-day uptrend as 200-HMA prods buyers.
- Convergence of 100-HMA, two-week-old ascending trend line restricts short-term Yen downside.
- Steady RSI suggests continuation of slower grind towards the north.
- Bears have a bumpy road towards the south with 133.50 acting as immediate key support.
The pair currently trades last at 135.057.
The previous day high was 135.3 while the previous day low was 134.64. The daily 38.2% Fib levels comes at 135.05, expected to provide support. Similarly, the daily 61.8% fib level is at 134.89, expected to provide support.
USD/JPY pares intraday gains around 135.10-05 during early Tuesday, pausing a two-day winning streak. In doing so, the Yen pair retreats from the 200-Hour Moving Average (HMA).
Also read: USD/JPY bulls cross 135.00 as BoJ’s Ueda defends monetary policy inaction, yields rise
In addition to a pullback from the 200-HMA, the steady RSI (14) line also favors the short-term weakness in the Yen pair prices. However, a convergence of the 100-HMA and a fortnight-old ascending trend line, close to 134.75 by the press time.
In a case where the USD/JPY bears manage to conquer the 137.75 key support, the previous weekly low of around 133.50 holds the key to the Yen pair’s slump toward the April month’s bottom of around 130.65.
Alternatively, a clear upside break of the 200-HMA, around 135.35 at the latest, has fewer hurdles toward the north unless the quote hits the 136.00 round figure.
Following that, multiple tops around the 137.90-138.00 area will be crucial to watch for the USD/JPY pair buyers as a sustained break of the same won’t hesitate to prod the 140.00 psychological magnet.
Overall, USD/JPY remains on the buyer’s radar even if a short-term pullback appears more likely.
Trend: Further recovery expected
Technical Levels: Supports and Resistances
USDJPY currently trading at 135.07 at the time of writing. Pair opened at 135.07 and is trading with a change of 0.00% % .
| Overview | Overview.1 | |
|---|---|---|
| 0 | Today last price | 135.07 |
| 1 | Today Daily Change | 0.00 |
| 2 | Today Daily Change % | 0.00% |
| 3 | Today daily open | 135.07 |
The pair is trading above its 20 Daily moving average @ 134.49, above its 50 Daily moving average @ 133.86 , above its 100 Daily moving average @ 132.82 and below its 200 Daily moving average @ 137.01
| Trends | Trends.1 | |
|---|---|---|
| 0 | Daily SMA20 | 134.49 |
| 1 | Daily SMA50 | 133.86 |
| 2 | Daily SMA100 | 132.82 |
| 3 | Daily SMA200 | 137.01 |
The previous day high was 135.3 while the previous day low was 134.64. The daily 38.2% Fib levels comes at 135.05, expected to provide support. Similarly, the daily 61.8% fib level is at 134.89, expected to provide support.
Note the levels of interest below:
- Pivot support is noted at 134.71, 134.35, 134.05
- Pivot resistance is noted at 135.37, 135.66, 136.02
| Levels | Levels.1 |
|---|---|
| Previous Daily High | 135.30 |
| Previous Daily Low | 134.64 |
| Previous Weekly High | 137.78 |
| Previous Weekly Low | 133.50 |
| Previous Monthly High | 136.56 |
| Previous Monthly Low | 130.63 |
| Daily Fibonacci 38.2% | 135.05 |
| Daily Fibonacci 61.8% | 134.89 |
| Daily Pivot Point S1 | 134.71 |
| Daily Pivot Point S2 | 134.35 |
| Daily Pivot Point S3 | 134.05 |
| Daily Pivot Point R1 | 135.37 |
| Daily Pivot Point R2 | 135.66 |
| Daily Pivot Point R3 | 136.02 |
[/s2If]
Nehcap Expert Advisor
The NEHCAP MT4 EA is high quality professional trading system geared to generate returns without using GRID or martingales. Each trade has strict risk per trade parameter. The pairs under management include EURUSD, GBPUSD, AUDCAD, AUDNZD,GBPAUD, EURAUD, EURCAD, CHFJPY and many more.
The system is trading live: LIVE ACCOUNT TRACKING
You can run it free. Apply for a free trial and track our account. Buy the system or use profit share mechanism to generate returns on your MT4.
Join Our Telegram Group
")


