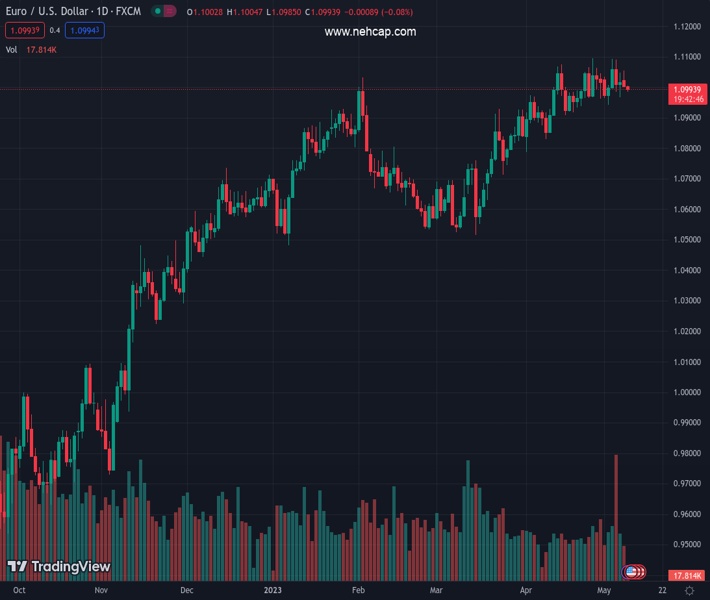
#EURUSD @ 1.09935 takes offers to refresh intraday low, extends the previous day’s losses. (Pivot Orderbook analysis)
…
This is a premium post.
[s2If !current_user_can(access_s2member_level4)]Please register for FREE REGISTER to read full post below containing analysis. In case of any error or you think you are not able to read the full post below, please email us at support#nehcap.com [lwa][/s2If] [s2If current_user_can(access_s2member_level1)]
- EUR/USD takes offers to refresh intraday low, extends the previous day’s losses.
- US Dollar Index picks up bids amid mixed sentiment, upbeat yields.
- Fears of US debt default, hawkish Fed speak supersede indecisive quarterly bank survey outcome to propel US Dollar.
- Risk catalysts eyed amid light calendar ahead of Wednesday’s US CPI.
The pair currently trades last at 1.09935.
The previous day high was 1.1054 while the previous day low was 1.1. The daily 38.2% Fib levels comes at 1.1021, expected to provide resistance. Similarly, the daily 61.8% fib level is at 1.1033, expected to provide resistance.
EUR/USD holds onto the week-start losses as Euro bears prod a 1.1000 round figure, down 0.17% intraday near 1.0990 during early Tuesday. In doing so, the major currency pair takes clues from the market’s mixed sentiment and the US Dollar rebound, as well as recently softer Eurozone data.
That said, the US Dollar Index (DXY) extends the previous day’s rebound amid firmer yields and mixed signals surrounding inflation and banking conditions. The benchmark US 10-year Treasury bond yields rose in the last three consecutive days to 3.51% at the latest whereas the US inflation expectations as per the 10-year and 5-year breakeven inflation rates from the St. Louis Federal Reserve (FRED) data jumped to a one-week high the previous day.
Elsewhere, the Federal Reserve’s (Fed) quarterly bank loan survey showed tighter standards and weaker demand for commercial and industrial (C&I) loans to large and middle-market firms, as well as small firms, over the first quarter.
Furthermore, unimpressive comments from Chicago Federal Reserve Bank President Austan Goolsbee and US Treasury Secretary Janet Yellen’s fears of US default weigh on the EUR/USD price, especially amid recently downbeat EU data.
On Monday, German Industrial Production for March slumped to -3.4% MoM versus -1.0% expected 2.1% prior. Further, the Eurozone Sentix Investor Confidence also deteriorated to -13.1 for May from -8.7 prior and -8.0 market forecasts.
It’s worth noting that European Central Bank chief economist Philip Lane said that there was “a lot of disinflation” coming later this year but added that there was still “a lot of momentum” in inflation. His comments also exert downside pressure on the EUR/USD price amid mildly offered S&P 500 Futures.
Moving on, a light calendar emphasizes the need to look out for risk catalysts while forecasting the EUR/USD moves.
Given the higher low of the EUR/USD price joining higher RSI (14), the major currency pair is likely to regain upside momentum. The same highlights a three-week-old bullish channel, currently between 1.0960 and 1.1180, as the key challenge for the Euro bears to conquer before taking control.
Technical Levels: Supports and Resistances
EURUSD currently trading at 1.0987 at the time of writing. Pair opened at 1.1007 and is trading with a change of -0.18% % .
| Overview | Overview.1 | |
|---|---|---|
| 0 | Today last price | 1.0987 |
| 1 | Today Daily Change | -0.0020 |
| 2 | Today Daily Change % | -0.18% |
| 3 | Today daily open | 1.1007 |
The pair is trading below its 20 Daily moving average @ 1.0997, above its 50 Daily moving average @ 1.0847 , above its 100 Daily moving average @ 1.0786 and above its 200 Daily moving average @ 1.0438
| Trends | Trends.1 | |
|---|---|---|
| 0 | Daily SMA20 | 1.0997 |
| 1 | Daily SMA50 | 1.0847 |
| 2 | Daily SMA100 | 1.0786 |
| 3 | Daily SMA200 | 1.0438 |
The previous day high was 1.1054 while the previous day low was 1.1. The daily 38.2% Fib levels comes at 1.1021, expected to provide resistance. Similarly, the daily 61.8% fib level is at 1.1033, expected to provide resistance.
Note the levels of interest below:
- Pivot support is noted at 1.0987, 1.0967, 1.0933
- Pivot resistance is noted at 1.104, 1.1074, 1.1094
| Levels | Levels.1 |
|---|---|
| Previous Daily High | 1.1054 |
| Previous Daily Low | 1.1000 |
| Previous Weekly High | 1.1092 |
| Previous Weekly Low | 1.0942 |
| Previous Monthly High | 1.1095 |
| Previous Monthly Low | 1.0788 |
| Daily Fibonacci 38.2% | 1.1021 |
| Daily Fibonacci 61.8% | 1.1033 |
| Daily Pivot Point S1 | 1.0987 |
| Daily Pivot Point S2 | 1.0967 |
| Daily Pivot Point S3 | 1.0933 |
| Daily Pivot Point R1 | 1.1040 |
| Daily Pivot Point R2 | 1.1074 |
| Daily Pivot Point R3 | 1.1094 |
[/s2If]
Nehcap Expert Advisor
The NEHCAP MT4 EA is high quality professional trading system geared to generate returns without using GRID or martingales. Each trade has strict risk per trade parameter. The pairs under management include EURUSD, GBPUSD, AUDCAD, AUDNZD,GBPAUD, EURAUD, EURCAD, CHFJPY and many more.
The system is trading live: LIVE ACCOUNT TRACKING
You can run it free. Apply for a free trial and track our account. Buy the system or use profit share mechanism to generate returns on your MT4.
Join Our Telegram Group
")


