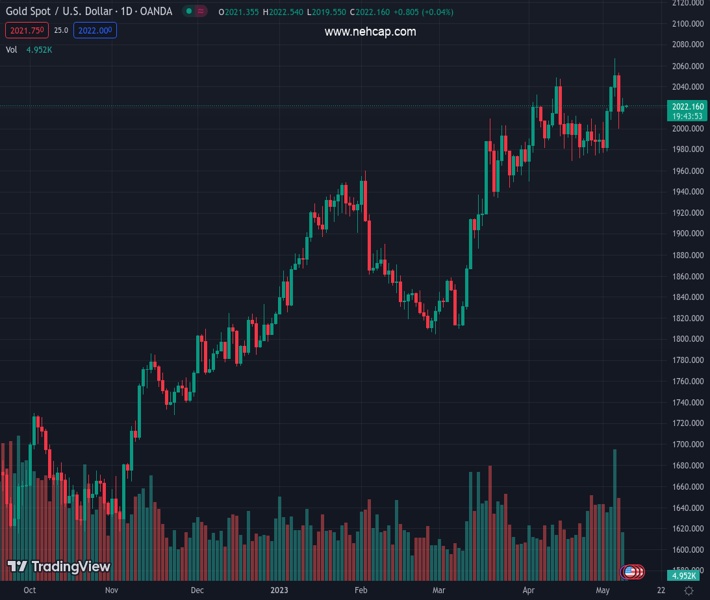
#XAUUSD @ 2,021.72 Gold price has checked in below the $2,020.00 support amid a recovery in the USD Index. (Pivot Orderbook analysis)
…
This is a premium post.
[s2If !current_user_can(access_s2member_level4)]Please register for FREE REGISTER to read full post below containing analysis. In case of any error or you think you are not able to read the full post below, please email us at support#nehcap.com [lwa][/s2If] [s2If current_user_can(access_s2member_level1)]
- Gold price has checked in below the $2,020.00 support amid a recovery in the USD Index.
- A rise in US debt ceiling will flush significant liquidity into the economy and would improve appeal for the Gold as safe-haven.
- Gold price is declining towards the lower portion of the Rising Channel pattern plotted from $1,934.34.
The pair currently trades last at 2021.72.
The previous day high was 2029.41 while the previous day low was 2014.36. The daily 38.2% Fib levels comes at 2023.66, expected to provide resistance. Similarly, the daily 61.8% fib level is at 2020.11, expected to provide support.
Gold price (XAU/USD) sensed selling pressure while attempting to surpass the critical resistance of $2,030.00 in the Asian session. The precious metal has corrected to near $2,020.00 and is expected to display more weakness as the US Dollar Index (DXY) has shown a stellar recovery.
The USD Index has climbed above 101.50 on expectations that more stubborn inflation data after incremental Nonfarm Payrolls (NFP) report could force the Federal Reserve (Fed) to keep interest rates higher for a longer period. According to the preliminary report, headline inflation is seen steady at 5.0% while the core Consumer Price Index (CPI) that excludes oil and food prices is seen softening to 5.5% vs. the prior release of 5.6%.
Meanwhile, S&P500 futures have added more losses in Asia. The 500-US stocks basket remained lackluster on Monday as investors demand clarity over US debt ceiling discussions. US President Joe Biden has invited some top Republican leaders for approving a debt ceiling raise to avoid further delay as it could severely damage the US economy. Republican House of Representatives Speaker Kevin McCarthy is expected to negotiate heavily on spending initiatives to cut the deepening Budget deficit.
A rise in the US debt ceiling will flush significant liquidity into the economy and would improve the appeal of the Gold price as safe-haven.
Gold price is declining towards the lower portion of the Rising Channel chart pattern plotted from March 22 low at $1,934.34 on a four-hour scale. The 20-period Exponential Moving Average (EMA) at $2,024.26 has acted as a barricade of the Gold bulls.
Meanwhile, the Relative Strength Index (RSI) (14) has shifted into the 40.00-60.00 range from the bullish range of 60.00-80.00, indicating exhaustion in the upside momentum.
Technical Levels: Supports and Resistances
XAUUSD currently trading at 2020.2 at the time of writing. Pair opened at 2021.16 and is trading with a change of -0.05 % .
| Overview | Overview.1 | |
|---|---|---|
| 0 | Today last price | 2020.20 |
| 1 | Today Daily Change | -0.96 |
| 2 | Today Daily Change % | -0.05 |
| 3 | Today daily open | 2021.16 |
The pair remains strongly bullish on the daily timeframe. It trades above its 20 SMA @ 2006.29, 50 SMA 1956.97, 100 SMA @ 1911.16 and 200 SMA @ 1815.94.
| Trends | Trends.1 | |
|---|---|---|
| 0 | Daily SMA20 | 2006.29 |
| 1 | Daily SMA50 | 1956.97 |
| 2 | Daily SMA100 | 1911.16 |
| 3 | Daily SMA200 | 1815.94 |
The previous day high was 2029.41 while the previous day low was 2014.36. The daily 38.2% Fib levels comes at 2023.66, expected to provide resistance. Similarly, the daily 61.8% fib level is at 2020.11, expected to provide support.
Note the levels of interest below:
- Pivot support is noted at 2013.88, 2006.59, 1998.83
- Pivot resistance is noted at 2028.93, 2036.69, 2043.98
| Levels | Levels.1 |
|---|---|
| Previous Daily High | 2029.41 |
| Previous Daily Low | 2014.36 |
| Previous Weekly High | 2079.76 |
| Previous Weekly Low | 1977.12 |
| Previous Monthly High | 2048.75 |
| Previous Monthly Low | 1949.83 |
| Daily Fibonacci 38.2% | 2023.66 |
| Daily Fibonacci 61.8% | 2020.11 |
| Daily Pivot Point S1 | 2013.88 |
| Daily Pivot Point S2 | 2006.59 |
| Daily Pivot Point S3 | 1998.83 |
| Daily Pivot Point R1 | 2028.93 |
| Daily Pivot Point R2 | 2036.69 |
| Daily Pivot Point R3 | 2043.98 |
[/s2If]
Nehcap Expert Advisor
The NEHCAP MT4 EA is high quality professional trading system geared to generate returns without using GRID or martingales. Each trade has strict risk per trade parameter. The pairs under management include EURUSD, GBPUSD, AUDCAD, AUDNZD,GBPAUD, EURAUD, EURCAD, CHFJPY and many more.
The system is trading live: LIVE ACCOUNT TRACKING
You can run it free. Apply for a free trial and track our account. Buy the system or use profit share mechanism to generate returns on your MT4.
Join Our Telegram Group
")


