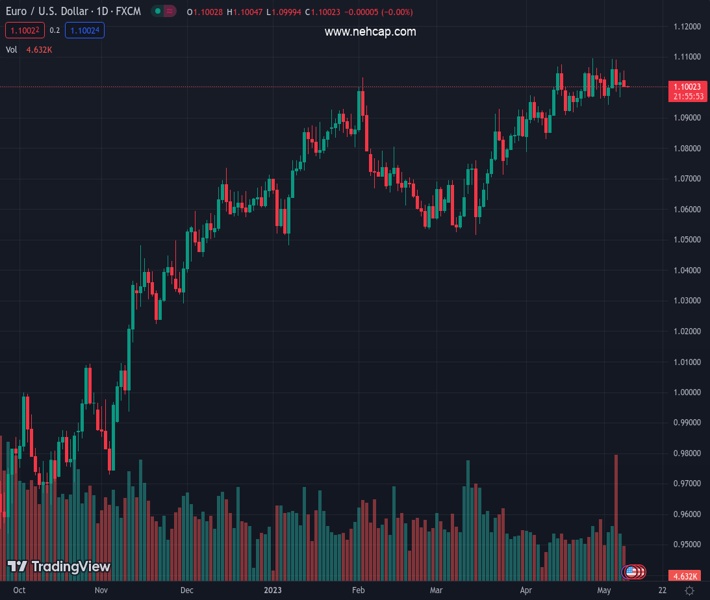
#EURUSD @ 1.10016 has extended its correction to near 1.1000 as investors await US Inflation for further guidance. (Pivot Orderbook analysis)
…
This is a premium post.
[s2If !current_user_can(access_s2member_level4)]Please register for FREE REGISTER to read full post below containing analysis. In case of any error or you think you are not able to read the full post below, please email us at support#nehcap.com [lwa][/s2If] [s2If current_user_can(access_s2member_level1)]
- EUR/USD has extended its correction to near 1.1000 as investors await US Inflation for further guidance.
- S&P500 futures are showing nominal losses after a choppy trade, portraying caution ahead of US debt ceiling talks.
- German Industrial Orders dropped sharply, suffering heavily from global interest rate hikes, which have impacted demand for automobiles.
The pair currently trades last at 1.10016.
The previous day high was 1.1048 while the previous day low was 1.0967. The daily 38.2% Fib levels comes at 1.1017, expected to provide resistance. Similarly, the daily 61.8% fib level is at 1.0998, expected to provide support.
The EUR/USD pair has corrected sharply to near the psychological support of 1.1000 in the early Tokyo session amid a recovery move in the US Dollar. The Euro remained under pressure on Monday after worse German Industrial Orders data. The economic data fell by 10.7%, suffering heavily from global interest rate hikes, which have impacted demand for automobiles. Also, the Gross Domestic Product (GDP) figures, Retail Sales, and exports were downbeat in March, strengthening signs of recession in the economy.
S&P500 futures are showing nominal losses in the Asian session after a choppy trade, portraying caution ahead of US debt ceiling talks. The US Dollar Index (DXY) is looking to extend its recovery above 101.40 as the focus has shifted to the US Inflation data, which is scheduled for Wednesday.
EUR/USD is auctioning in an Ascending Triangle chart pattern on a four-hour scale, which indicates a sheer contraction in volatility. The upward-sloping trendline of the aforementioned chart pattern is placed from April 17 low at 1.0924 while the horizontal resistance is plotted from April 14 high at 1.1076.
A sideways action from the 20-period Exponential Moving Average (EMA) around 1.1024 is hinting at a lackluster performance by the shared currency pair.
The Relative Strength Index (RSI) (14) is oscillating in the 40.00-60.00 range, signaling that investors are awaiting a potential trigger for decisive action.
Going ahead, a downside move below May 02 low at 1.0942 will drag the asset towards April 12 low at 1.0915 and April 10 low at 1.0837
On the flip side, a decisive move above April 26 high at 1.1095 will drive the asset toward a fresh 13-month high at 1.1185 followed by the round-level resistance at 1.1200.
Technical Levels: Supports and Resistances
EURUSD currently trading at 1.1003 at the time of writing. Pair opened at 1.102 and is trading with a change of -0.15 % .
| Overview | Overview.1 | |
|---|---|---|
| 0 | Today last price | 1.1003 |
| 1 | Today Daily Change | -0.0017 |
| 2 | Today Daily Change % | -0.1500 |
| 3 | Today daily open | 1.1020 |
The pair remains strongly bullish on the daily timeframe. It trades above its 20 SMA @ 1.0989, 50 SMA 1.0839, 100 SMA @ 1.0782 and 200 SMA @ 1.0434.
| Trends | Trends.1 | |
|---|---|---|
| 0 | Daily SMA20 | 1.0989 |
| 1 | Daily SMA50 | 1.0839 |
| 2 | Daily SMA100 | 1.0782 |
| 3 | Daily SMA200 | 1.0434 |
The previous day high was 1.1048 while the previous day low was 1.0967. The daily 38.2% Fib levels comes at 1.1017, expected to provide resistance. Similarly, the daily 61.8% fib level is at 1.0998, expected to provide support.
Note the levels of interest below:
- Pivot support is noted at 1.0975, 1.0931, 1.0894
- Pivot resistance is noted at 1.1056, 1.1093, 1.1137
| Levels | Levels.1 |
|---|---|
| Previous Daily High | 1.1048 |
| Previous Daily Low | 1.0967 |
| Previous Weekly High | 1.1092 |
| Previous Weekly Low | 1.0942 |
| Previous Monthly High | 1.1095 |
| Previous Monthly Low | 1.0788 |
| Daily Fibonacci 38.2% | 1.1017 |
| Daily Fibonacci 61.8% | 1.0998 |
| Daily Pivot Point S1 | 1.0975 |
| Daily Pivot Point S2 | 1.0931 |
| Daily Pivot Point S3 | 1.0894 |
| Daily Pivot Point R1 | 1.1056 |
| Daily Pivot Point R2 | 1.1093 |
| Daily Pivot Point R3 | 1.1137 |
[/s2If]
Nehcap Expert Advisor
The NEHCAP MT4 EA is high quality professional trading system geared to generate returns without using GRID or martingales. Each trade has strict risk per trade parameter. The pairs under management include EURUSD, GBPUSD, AUDCAD, AUDNZD,GBPAUD, EURAUD, EURCAD, CHFJPY and many more.
The system is trading live: LIVE ACCOUNT TRACKING
You can run it free. Apply for a free trial and track our account. Buy the system or use profit share mechanism to generate returns on your MT4.
Join Our Telegram Group
")


