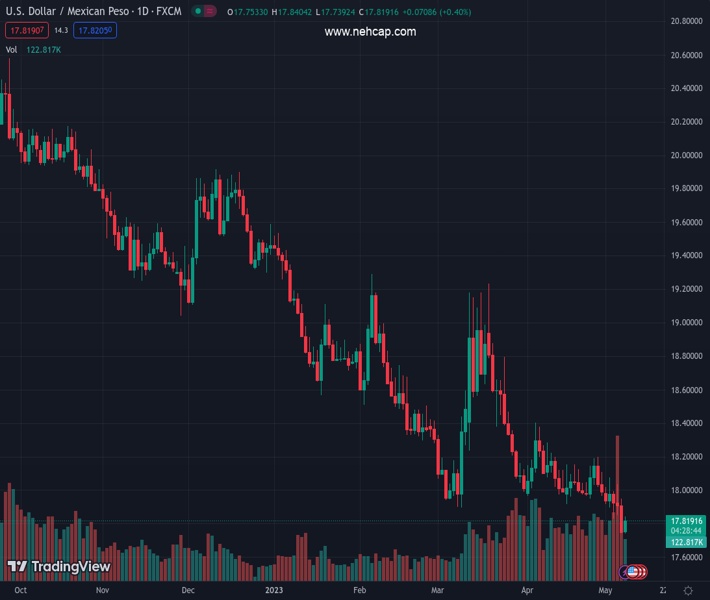
#USDMXN @ 17.8195 climbs back above 17.80 at the beginning of the week. (Pivot Orderbook analysis)
…
This is a premium post.
[s2If !current_user_can(access_s2member_level4)]Please register for FREE REGISTER to read full post below containing analysis. In case of any error or you think you are not able to read the full post below, please email us at support#nehcap.com [lwa][/s2If] [s2If current_user_can(access_s2member_level1)]
- USD/MXN climbs back above 17.80 at the beginning of the week.
- Inflation data this week to shed light on Fed’s June meeting.
- Mexican inflation figures to give USD/MXN traders clues for Banxico’s monetary policy meeting on May 18.
The pair currently trades last at 17.8195.
The previous day high was 17.9497 while the previous day low was 17.7459. The daily 38.2% Fib levels comes at 17.8238, expected to provide resistance. Similarly, the daily 61.8% fib level is at 17.8719, expected to provide resistance.
The USD/MXN makes a U-turn and climbs back above the 17.80 figure at the beginning of the week, as US Treasury bond yields edge up, while a risk-off impulse keeps Wall Street in the red. Solid data from the United States (US) cushioned the last week’s USD/MXN fall. At the same time, speculations that the Mexican central bank will pause its tightening cycle could trigger outflows from the emerging market currency. At the time of writing, the USD/MXN is trading at 17.8354.
The US Dollar (USD) has shown signs of recovery against the Mexican Peso (MXN). Last Friday, the latest US jobs report showed signs of tightness, which warrants further action by the US Federal Reserve (Fed). Even though the Fed opened the door for a pause on its tightening cycle, this week’s inflation data could shed some light on what the Fed can do in June’s meeting.
Meanwhile, discussions about the US debt ceiling shifted sentiment sour. According to Janet Yellen, the US Treasury Secretary, there are no favorable alternatives to resolve the debt limit issue in Washington without assistance from the US Congress.
The US economic docket revealed data from the US Department of Commerce. Wholesale Inventories for March came at 0% MoM, below estimates of 0.1% expansion, though annually-based figures showed an improvement.
On the Mexican front, the agenda is empty for Monday. Still, on Tuesday, inflation figures would give USD/MXN traders some clues regarding the Bank of Mexico’s (Banxico) path toward its May 18 monetary policy meeting.
Once the USD/MXN found its floor around 17.7405, hitting six-year lows, the USD/MXN jumped off the year-to-date (YTD) low toward the 17.80 area. Even though the USD/MXN is still downward biased, a divergence between the Relative Strength Index (RSI) indicator printing higher troughs while the USD/MXN pair registers lower lows suggests that selling pressure is fading. If USD/MXN climbs above 18.0000, that will expose the 50-day EMA at 18.2087. A breach of the latter and above the April 26 high would open the door to test April’s high of 18.4008, followed by the 100-day EMA at 18.5371.
Technical Levels: Supports and Resistances
USDMXN currently trading at 17.829 at the time of writing. Pair opened at 17.7568 and is trading with a change of 0.41 % .
| Overview | Overview.1 | |
|---|---|---|
| 0 | Today last price | 17.8290 |
| 1 | Today Daily Change | 0.0722 |
| 2 | Today Daily Change % | 0.4100 |
| 3 | Today daily open | 17.7568 |
The pair remains strongly bearish on the daily time frame. It trades below the 20 SMA @ 18.0171, 50 SMA 18.2189, 100 SMA @ 18.5884 and 200 SMA @ 19.2311.
| Trends | Trends.1 | |
|---|---|---|
| 0 | Daily SMA20 | 18.0171 |
| 1 | Daily SMA50 | 18.2189 |
| 2 | Daily SMA100 | 18.5884 |
| 3 | Daily SMA200 | 19.2311 |
The previous day high was 17.9497 while the previous day low was 17.7459. The daily 38.2% Fib levels comes at 17.8238, expected to provide resistance. Similarly, the daily 61.8% fib level is at 17.8719, expected to provide resistance.
Note the levels of interest below:
- Pivot support is noted at 17.6853, 17.6137, 17.4815
- Pivot resistance is noted at 17.8891, 18.0213, 18.0929
| Levels | Levels.1 |
|---|---|
| Previous Daily High | 17.9497 |
| Previous Daily Low | 17.7459 |
| Previous Weekly High | 18.0780 |
| Previous Weekly Low | 17.7459 |
| Previous Monthly High | 18.4018 |
| Previous Monthly Low | 17.9329 |
| Daily Fibonacci 38.2% | 17.8238 |
| Daily Fibonacci 61.8% | 17.8719 |
| Daily Pivot Point S1 | 17.6853 |
| Daily Pivot Point S2 | 17.6137 |
| Daily Pivot Point S3 | 17.4815 |
| Daily Pivot Point R1 | 17.8891 |
| Daily Pivot Point R2 | 18.0213 |
| Daily Pivot Point R3 | 18.0929 |
[/s2If]
Nehcap Expert Advisor
The NEHCAP MT4 EA is high quality professional trading system geared to generate returns without using GRID or martingales. Each trade has strict risk per trade parameter. The pairs under management include EURUSD, GBPUSD, AUDCAD, AUDNZD,GBPAUD, EURAUD, EURCAD, CHFJPY and many more.
The system is trading live: LIVE ACCOUNT TRACKING
You can run it free. Apply for a free trial and track our account. Buy the system or use profit share mechanism to generate returns on your MT4.
Join Our Telegram Group
")


