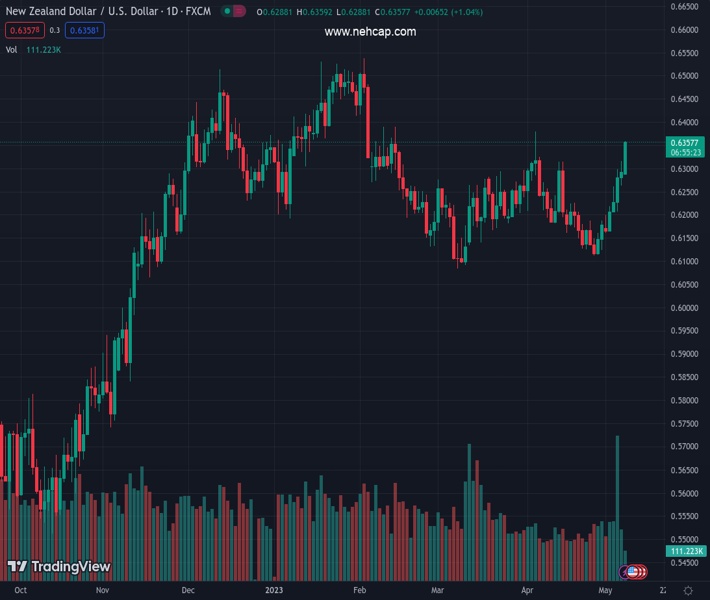
#NZDUSD @ 0.63584 gains strong traction for the fourth straight day and climbs to over a one-month high. (Pivot Orderbook analysis)
…
This is a premium post.
[s2If !current_user_can(access_s2member_level4)]Please register for FREE REGISTER to read full post below containing analysis. In case of any error or you think you are not able to read the full post below, please email us at support#nehcap.com [lwa][/s2If] [s2If current_user_can(access_s2member_level1)]
- NZD/USD gains strong traction for the fourth straight day and climbs to over a one-month high.
- The technical setup favours bullish traders bulls and supports prospects for additional gains.
- Any meaningful dip towards the descending trend-line breakout is likely to get bought into.
The pair currently trades last at 0.63584.
The previous day high was 0.6316 while the previous day low was 0.6263. The daily 38.2% Fib levels comes at 0.6284, expected to provide support. Similarly, the daily 61.8% fib level is at 0.6296, expected to provide support.
The NZD/USD pair prolongs its recent upward trajectory witnessed over the past two weeks or so and continues scaling higher for the fifth successive day on Monday. This also marks the seventh day of a positive move in the previous eight and lifts spot prices to over a one-month high, around the 0.6350 region heading into the North American session.
The US Dollar (USD) languishes near the monthly low touched last week amid firming expectations that the Federal Reserve (Fed) is nearing the end of its year-long rate-hiking cycles. This, along with concerns about the US debt ceiling and the risk-on impulse, further undermines the safe-haven Greenback and provides an additional lift to the risk-sensitive Kiwi.
From a technical perspective, the momentum allows the NZD/USD pair to break through a short-term descending trend-line hurdle extending from the YTD peak touched in February. Given that oscillators on the daily chart holding comfortably in the bullish territory and are still far from being in the overbought zone, the set-up supports prospects for additional gains.
Hence, a subsequent move towards retesting the April monthly swing low, around the 0.6380 region, en route to the 0.6400 mark, looks like a distinct possibility. Some follow-through buying has the potential to lift the NZD/USD pair towards the next relevant hurdle near the 0.6435-0.6440 region, above which bulls might aim to reclaim the 0.6500 psychological mark.
On the flip side, the descending trend-line resistance breakpoint, currently pegged just below the 0.6300 round-figure mark, now seems to protect the immediate downside. Any further decline is more likely to attract fresh buyers and remains limited near the 200-day Simple Moving Average (SMA), around the 0.6255 zone, which should act as a strong base for the NZD/USD pair.
Technical Levels: Supports and Resistances
NZDUSD currently trading at 0.6353 at the time of writing. Pair opened at 0.6275 and is trading with a change of 1.24 % .
| Overview | Overview.1 | |
|---|---|---|
| 0 | Today last price | 0.6353 |
| 1 | Today Daily Change | 0.0078 |
| 2 | Today Daily Change % | 1.2400 |
| 3 | Today daily open | 0.6275 |
The pair remains strongly bullish on the daily timeframe. It trades above its 20 SMA @ 0.6197, 50 SMA 0.621, 100 SMA @ 0.6279 and 200 SMA @ 0.616.
| Trends | Trends.1 | |
|---|---|---|
| 0 | Daily SMA20 | 0.6197 |
| 1 | Daily SMA50 | 0.6210 |
| 2 | Daily SMA100 | 0.6279 |
| 3 | Daily SMA200 | 0.6160 |
The previous day high was 0.6316 while the previous day low was 0.6263. The daily 38.2% Fib levels comes at 0.6284, expected to provide support. Similarly, the daily 61.8% fib level is at 0.6296, expected to provide support.
Note the levels of interest below:
- Pivot support is noted at 0.6253, 0.6232, 0.62
- Pivot resistance is noted at 0.6306, 0.6338, 0.6359
| Levels | Levels.1 |
|---|---|
| Previous Daily High | 0.6316 |
| Previous Daily Low | 0.6263 |
| Previous Weekly High | 0.6316 |
| Previous Weekly Low | 0.6160 |
| Previous Monthly High | 0.6389 |
| Previous Monthly Low | 0.6111 |
| Daily Fibonacci 38.2% | 0.6284 |
| Daily Fibonacci 61.8% | 0.6296 |
| Daily Pivot Point S1 | 0.6253 |
| Daily Pivot Point S2 | 0.6232 |
| Daily Pivot Point S3 | 0.6200 |
| Daily Pivot Point R1 | 0.6306 |
| Daily Pivot Point R2 | 0.6338 |
| Daily Pivot Point R3 | 0.6359 |
[/s2If]
Nehcap Expert Advisor
The NEHCAP MT4 EA is high quality professional trading system geared to generate returns without using GRID or martingales. Each trade has strict risk per trade parameter. The pairs under management include EURUSD, GBPUSD, AUDCAD, AUDNZD,GBPAUD, EURAUD, EURCAD, CHFJPY and many more.
The system is trading live: LIVE ACCOUNT TRACKING
You can run it free. Apply for a free trial and track our account. Buy the system or use profit share mechanism to generate returns on your MT4.
Join Our Telegram Group
")


